
Fig. 5
- ID
- ZDB-FIG-250814-105
- Publication
- Hsu et al., 2025 - Single cell transcriptomes of zebrafish germline reveal progenitor types and feminization by Foxl2l
- Other Figures
-
- Fig. 1
- Fig. 1 - Supplemental 1
- Fig. 1 - Supplemental 2
- Fig. 1 - Supplemental 3
- Fig. 1 - Supplemental 4
- Fig. 2
- Fig. 2 - Supplemental 1
- Fig. 3
- Fig. 3 - Supplemental 1
- Fig. 3 - Supplemental 2
- Fig. 3 - Supplemental 3
- Fig. 3 - Supplemental 4
- Fig. 4
- Fig. 4 - Supplemental 1
- Fig. 5
- Fig. 5 - Supplemental 1
- Fig. 6
- All Figure Page
- Back to All Figure Page
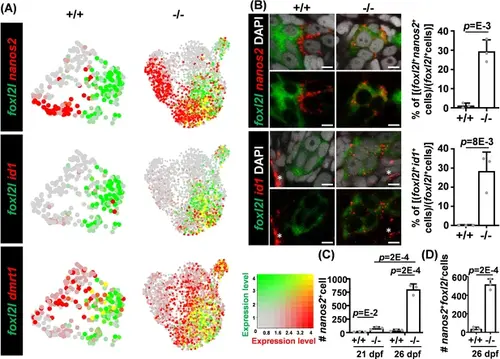
Aberrant co-expression of foxl2l with dmrt1, id1, and nanos2. (A) Uniform Manifold Approximation and Projection (UMAP) visualization of dmrt1+, nanos2+, or id1+ cells and foxl2l+ cells. Left: wild-type (WT) cells in clusters W1 to W5 (+/+). Right: foxl2l mutant (-/-) cells. Yellow dots indicate cells co-expressing both genes. (B) Increased proportions of foxl2l mutant cells co-expressing foxl2l with nanos2 or id1. (Left) Double RNA fluorescence in situ hybridization (FISH) detecting nanos2 or id1 with foxl2l in WT (+/+) or foxl2l10i/10i homozygous mutant (-/-) gonads at 26 days post fertilization (dpf). Stained images are shown with (top panels) or without (bottom panels) DAPI in each set. Asterisks represent the expression of id1 in somatic cells. Scale bars represent 5 µm. (Right) Quantitation of the proportion of double positive cells in each gonad is shown. One dot represents the data from one gonad, n=3 in each genotype of each graph. (C) Increased numbers of nanos2-expressing cells in foxl2l10i/10i homozygous mutant gonad (-/-). One dot represents the data from one gonad, n=3 in each genotype of each age. (D) Increased number of nanos2+foxl2l- germline stem cells (GSCs) in foxl2l10i/10i homozygous mutant gonad (-/-). One dot represents the data from one gonad, n=3 in each genotype. |