
Image
|
Figure Caption
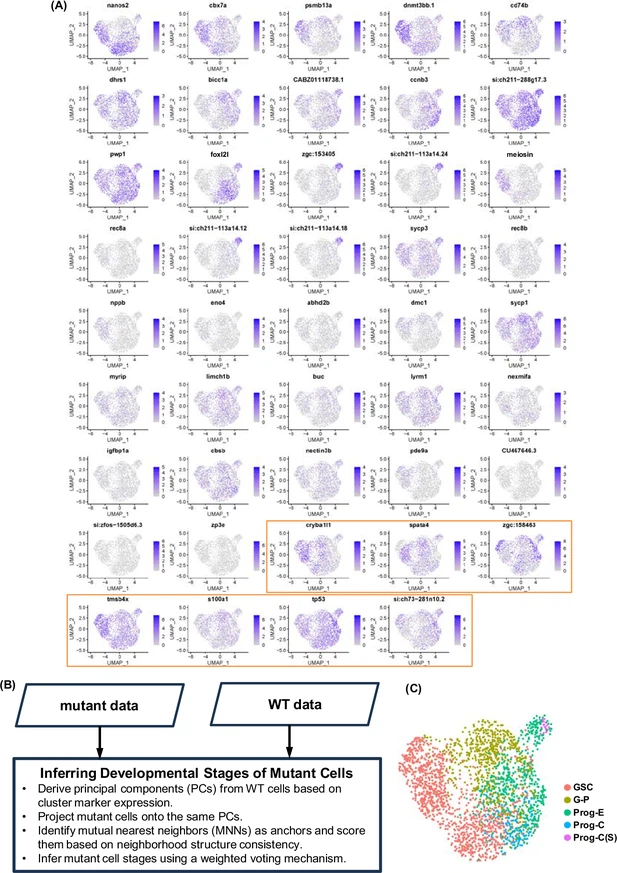
Fig. 3 - Supplemental 1 Transcriptome analysis of mutant germ cells. (A) Expression of 27 wild-type (WT) top marker genes and mutant top marker genes (in orange box) in mutant cells shown by Uniform Manifold Approximation and Projection (UMAP). The scales of the scores are shown at the right. (B) Flowchart of the inferring developmental stages of mutant cells. (C) Mutant cells shown in UMAP. Color of each mutant cell represents annotated developmental stage.
Acknowledgments
This image is the copyrighted work of the attributed author or publisher, and
ZFIN has permission only to display this image to its users.
Additional permissions should be obtained from the applicable author or publisher of the image.
Full text @ Elife