
FIGURE
Fig. 3 - Supplemental 2
- ID
- ZDB-FIG-250814-100
- Publication
- Hsu et al., 2025 - Single cell transcriptomes of zebrafish germline reveal progenitor types and feminization by Foxl2l
- Other Figures
-
- Fig. 1
- Fig. 1 - Supplemental 1
- Fig. 1 - Supplemental 2
- Fig. 1 - Supplemental 3
- Fig. 1 - Supplemental 4
- Fig. 2
- Fig. 2 - Supplemental 1
- Fig. 3
- Fig. 3 - Supplemental 1
- Fig. 3 - Supplemental 2
- Fig. 3 - Supplemental 3
- Fig. 3 - Supplemental 4
- Fig. 4
- Fig. 4 - Supplemental 1
- Fig. 5
- Fig. 5 - Supplemental 1
- Fig. 6
- All Figure Page
- Back to All Figure Page
Fig. 3 - Supplemental 2
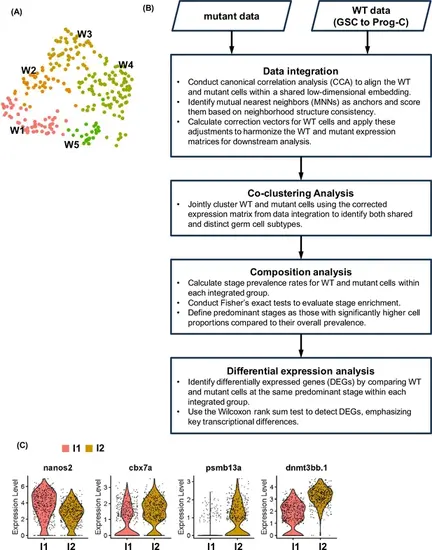
Transcriptome analysis of integrated groups. (A) Wild-type (WT) germ cells in clusters W1 to W5 visualized by Uniform Manifold Approximation and Projection (UMAP). (B) The flowchart of the co-clustering analysis. (C) Split-violin plots showing the distribution of cells expressing four top germline stem cell (GSC) markers in integrated groups I1 and I2. |
Expression Data
Expression Detail
Antibody Labeling
Phenotype Data
Phenotype Detail
Acknowledgments
This image is the copyrighted work of the attributed author or publisher, and
ZFIN has permission only to display this image to its users.
Additional permissions should be obtained from the applicable author or publisher of the image.
Full text @ Elife