
FIGURE
Fig. 1 - Supplemental 2
- ID
- ZDB-FIG-250814-93
- Publication
- Hsu et al., 2025 - Single cell transcriptomes of zebrafish germline reveal progenitor types and feminization by Foxl2l
- Other Figures
-
- Fig. 1
- Fig. 1 - Supplemental 1
- Fig. 1 - Supplemental 2
- Fig. 1 - Supplemental 3
- Fig. 1 - Supplemental 4
- Fig. 2
- Fig. 2 - Supplemental 1
- Fig. 3
- Fig. 3 - Supplemental 1
- Fig. 3 - Supplemental 2
- Fig. 3 - Supplemental 3
- Fig. 3 - Supplemental 4
- Fig. 4
- Fig. 4 - Supplemental 1
- Fig. 5
- Fig. 5 - Supplemental 1
- Fig. 6
- All Figure Page
- Back to All Figure Page
Fig. 1 - Supplemental 2
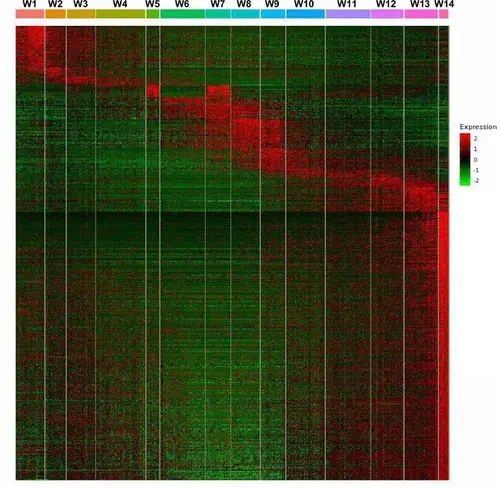
Analysis of wild-type (WT) clusters. Expression of marker genes (Y-axis) in each WT cluster (X-axis) in a heatmap. Genes that reach the criteria (fraction ≥0.8, specificity ≥0.2, q-value ≤0.01) are defined as marker genes. Expression value is visualized with a range between –2 and 2. |
Expression Data
Expression Detail
Antibody Labeling
Phenotype Data
Phenotype Detail
Acknowledgments
This image is the copyrighted work of the attributed author or publisher, and
ZFIN has permission only to display this image to its users.
Additional permissions should be obtained from the applicable author or publisher of the image.
Full text @ Elife