
Image
|
Figure Caption
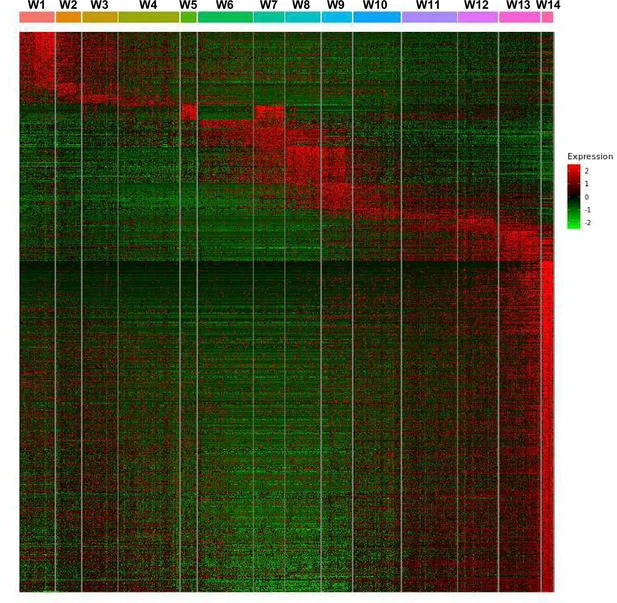
Fig. 1 - Supplemental 2 Analysis of wild-type (WT) clusters. Expression of marker genes (Y-axis) in each WT cluster (X-axis) in a heatmap. Genes that reach the criteria (fraction ≥0.8, specificity ≥0.2, q-value ≤0.01) are defined as marker genes. Expression value is visualized with a range between –2 and 2.
Acknowledgments
This image is the copyrighted work of the attributed author or publisher, and
ZFIN has permission only to display this image to its users.
Additional permissions should be obtained from the applicable author or publisher of the image.
Full text @ Elife