
Fig. 5
- ID
- ZDB-FIG-250805-57
- Publication
- Légaré et al., 2025 - Structural and genetic determinants of zebrafish functional brain networks
- Other Figures
- All Figure Page
- Back to All Figure Page
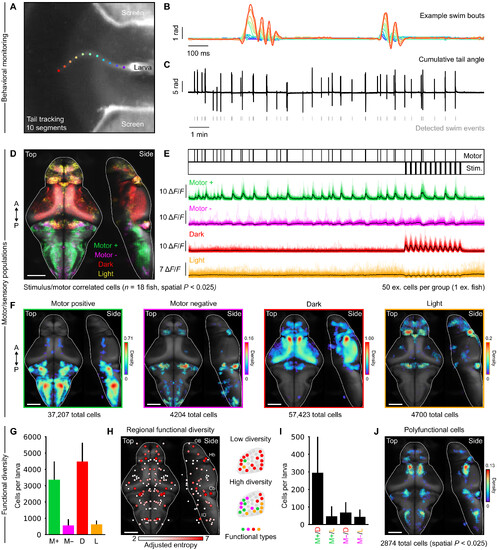
Identification of sensorimotor neuronal populations. (A) example camera frame from high-speed monitoring of a head-restrained larva with tail tracking points.(B) Angular time series of 10 tail segments displaying two successive swimming events; colors correspond to tracking points on the previous panel. (C) cumulative tailangle of one larva over a full experiment, with detected swimming events below. (D) Overlapped densities of motor-positive, motor- negative, dark-responsive, and light-responsive cells, projected on the mapZebrain template brain (n = 18 larvae, spatial) P < 0.025. (E) top; Motor and stimulus event vectors. Bottom: 50 example cells perfunctional category (color traces) with average population activity (black traces). (F) individual cell densities from (d); the color map represents arbitrary spatial densityunits, relative to the maximum density observed in dark-responsive cells; the number of cells aggregated across animals and contributing to each distribution is indicatedbelow each panel; spatial P < 0.025. (G) number of cells per functional category per larva; error bars indicate Sd; statistical comparisons are avoided due to slight meth-odological differences between motor and visual cell identification (see Materials and Methods). (H) Left: Regional measure of functional diversity using adjusted Shannonentropy; nodes reflect region centroids, and node sizes are redundant with the color map. Right: Schematized examples of low and high diversities in a brain region.(I) number of overlapping cells for each nonorthogonal pair of functional categories per larva; error bars indicate Sd. (J) Spatial density of polyfunctional cells detectedacross all animals, spatial P < 0.025. A, anterior; P, posterior; M+, motor positive; M−, motor negative; d, dark; L, light. Scale bars, 100 μm. |