
Fig. 1
- ID
- ZDB-FIG-250805-53
- Publication
- Légaré et al., 2025 - Structural and genetic determinants of zebrafish functional brain networks
- Other Figures
- All Figure Page
- Back to All Figure Page
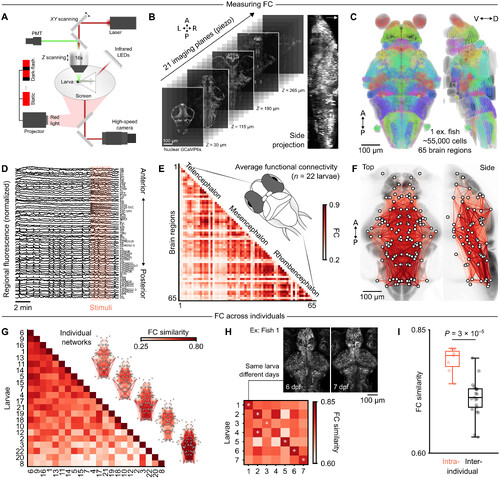
Brain-wide imaging of functional networks in zebrafish larvae. (A) experimental configuration for whole-brain two-photon imaging, light stimulus delivery, and behav-ioral monitoring in tg(elavl3:h2B-GcaMP6s) zebrafish larvae. (B) Five planes highlighted from 21 functional imaging planes at different depths (left); side projection in one examplefish (maximum intensity, right); white arrow indicates the dorsal side; refer to fig. S1 for image scales. (C) centroids of automatically identified neurons from one larva, registered tomapZebrain and mapped into 70 brain regions (pseudocolors; retina/eye is not displayed). (D) Regional fluorescence time series from one representative larva, ordered from ante-rior to posterior regions; a pink rectangle highlights a period of dark-flash visual stimuli. (E) Group-averaged Fc matrix (n = 22 larvae), ordered from anterior to posteriorregions. (F) network visualization of group-averaged Fc, using the same color map as the previous panel; nodes represent brain region centroids, and bottom quartile Fc edges arenot displayed; network edges are mirrored across both hemispheres for visualization. (G) Functional network similarity across larvae, ordered from the most globally similar to themost globally dissimilar individual; five example individual networks are plotted on the right. (H) Functional network similarity of seven larvae imaged on consecutivedays; similarity scores are averaged across both temporal directions, from dataset 1 to dataset 2 and vice versa; white asterisks denote maximal similarity values on each row.(I) network similarity scores are significantly higher when comparing individuals to themselves [diagonal values from matrix in (h)] rather than different individuals [off-diagonalvalues from matrix in (h)] (P = 3 × 10⁻⁵, t test). A, anterior; P, posterior; v, ventral; d, dorsal; L, left; R, right. |