
Fig. 4
- ID
- ZDB-FIG-250805-56
- Publication
- Légaré et al., 2025 - Structural and genetic determinants of zebrafish functional brain networks
- Other Figures
- All Figure Page
- Back to All Figure Page
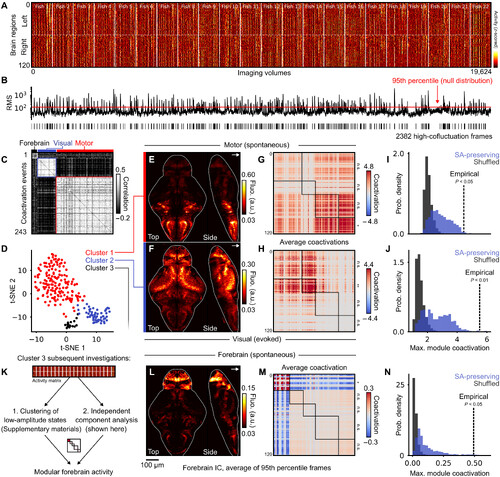
Mesoscopic coactivation patterns coincide with the modular organization of SC. (A) Raster plot of z- scored regional activity across 22 larvae. Left and righthemispheres are plotted in the upper and lower halves, respectively. (B) Root-mean-square (RMS) of regional coactivation values for each of the corresponding frames in(A); the red line indicates a statistical threshold for high coactivation events (P < 0.05, false discovery rate fixed at α = 0.05 using the Benjamini-hochberg procedure).(C) correlation matrix of 243 detected events, separated into three clusters that are illustrated in the following panel. (D) t-Sne projection of 243 high-amplitude events,with three clusters identified using density-based clustering. (E and F) Raw data projections of the two main clusters, coregistered and averaged across larvae (n = 22);top; high- amplitude motor events; bottom: high- amplitude visual responses to dark stimuli; contrast is adjusted after averaging (see Materials and Methods). a.u., arbi-trary units. (G and H) Average coactivation matrices of the two main clusters, reordered according to four structural modules; statistical significance of module coactiva-tions is indicated on right matrix borders. (I and J) null distributions of maximal module coactivation values in SA-preserving and SA-breaking surrogates; dashed linesindicate empirical coactivation values. (K) two independent analyses recover modular forebrain activity that was weakly detected as cluster 3 in the previous clusteringanalysis. (L) Averaged raw fluorescence from frames corresponding to the 95th percentile of forebrain ic activity. (M) Average coactivation matrix of frames belonging tothe 95th percentile of forebrain ic activity. (N) null distributions of forebrain modularity, similar to (i) and (J). |