
Fig. 3
- ID
- ZDB-FIG-250805-55
- Publication
- Légaré et al., 2025 - Structural and genetic determinants of zebrafish functional brain networks
- Other Figures
- All Figure Page
- Back to All Figure Page
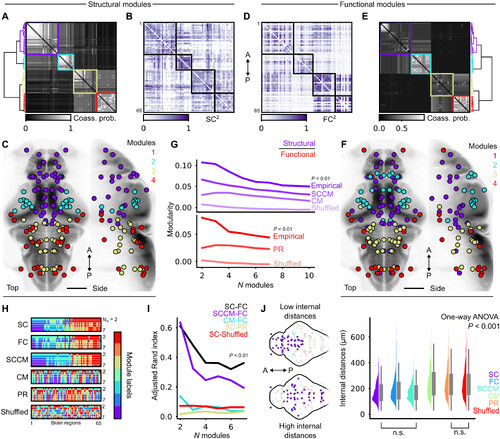
Structural and functional modules are spatially overlapped at multiple hierarchical levels. (A and D) Module coassignment probability matrices, hierarchi-cally clustered using Ward’s linkage (for Sc and Fc, respectively); four modules are chosen arbitrarily as an intermediary hierarchical level for visualization. (B and E) con-nectivity matrices, reordered by modules according to the previous panels (Sc and Fc, respectively); colors are mapped to squared edge weights for better contrast.(C and F) Brain region centroids colored by module membership (Sc and Fc, respectively); scale bars, 100 μm. (G) Structural and functional modularity at different hierar-chical levels, compared against various null models. Sc modularity curves are plotted above (purple), and Fc curves are below (red); 99th percentiles of null distributionsare plotted for null models. SccM, spatially constrained configuration model; cM, configuration model; PR, phase-randomized time series (see Materials and Methods).(H) Module identity vectors plotted at different hierarchical levels, for both empirical data and null models; N m denotes the number of modules; representative labels areshown for each null model. (I) Adjusted Rand index computed on pairs of module labels from the previous panel at different hierarchical levels; 99th percentiles of nulldistributions are plotted. (J) Left: visual examples of spatially compact (top) versus distributed (bottom) modules. Right: Boxplots of pairwise internal distances betweenregions belonging to the same modules, compiled across all hierarchical levels; all distributions are different with the exception of two comparisons, as indicated belowthe figure (one-way AnOvA, P < 0.001, followed by tukey’s post hoc test for pairwise comparisons). |