
FIGURE
Fig. 6
- ID
- ZDB-FIG-250714-27
- Publication
- Berger et al., 2024 - Sept10 and sept12 are expressed in specific proliferating cells in zebrafish brain
- Other Figures
- All Figure Page
- Back to All Figure Page
Fig. 6
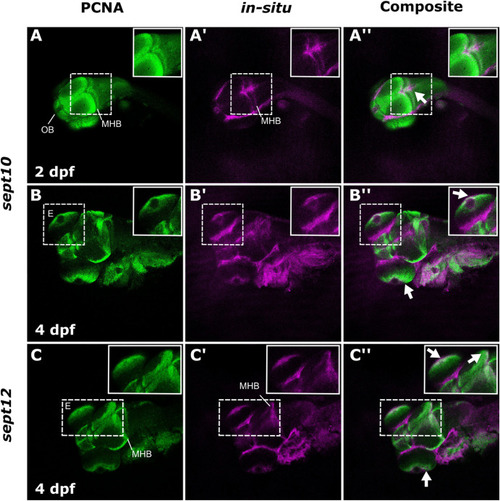
Correlation of sept10 and sept12 expression and PCNA labeling. A – C: PCNA staining of larval zebrafish at the indicated time points. A’ – C’: RNA WISH staining against sept10 or sept12. Note the overlapping of both stainings (indicated by white arrows) in the merged images A’’ – C’‘. The inserts show magnifications of overlapping regions. See list for abbreviations. |
Expression Data
| Genes: | |
|---|---|
| Fish: | |
| Anatomical Terms: | |
| Stage Range: | Long-pec to Day 4 |
Expression Detail
Antibody Labeling
Phenotype Data
Phenotype Detail
Acknowledgments
This image is the copyrighted work of the attributed author or publisher, and
ZFIN has permission only to display this image to its users.
Additional permissions should be obtained from the applicable author or publisher of the image.
Reprinted from Gene expression patterns : GEP, , Berger, C., Charlotte Kreß, J.K., Helmprobst, F., Sept10 and sept12 are expressed in specific proliferating cells in zebrafish brain, 119387, Copyright (2024) with permission from Elsevier. Full text @ Gene Expr. Patterns