
- Title
-
Sept10 and sept12 are expressed in specific proliferating cells in zebrafish brain
- Authors
- Berger, C., Charlotte Kreß, J.K., Helmprobst, F.
- Source
- Full text @ Gene Expr. Patterns
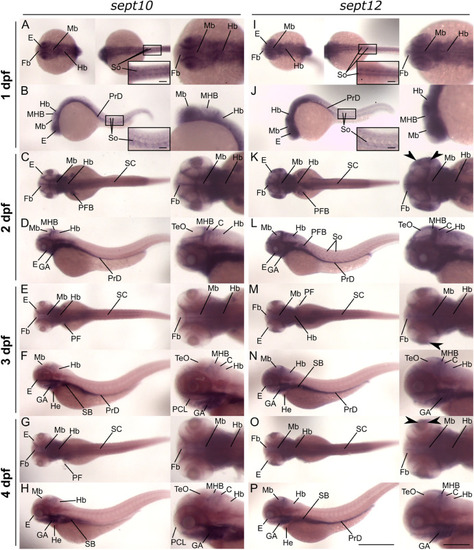
Expression pattern of sept10 and sept12 revealed by RNA WISH in zebrafish embryos and early larvae. Zebrafish embryos stained for sept10 or sept12 expression by RNA WISH at 1–4 dpf shown in dorsal (upper image) or lateral (lower image) view. Magnified views of the head structure are shown as enlarged images. Boxed images show somites (So) at a higher magnification. A-H: larvae exhibited early sept10 expression in anterior ventral structures, brain and in single So at 1 and 2 dpf. At 3 and 4 dpf expression was detectable mostly in the gill arches (GA) and in the brain. I - P: sept12 expression was visible in ventral structures and single somites (So) at 1 dpf and elevated in brain and pronephric duct (PrD) at 2 dpf. Expression in pronephric duct (PrD) persisted at later stages, while brain expression was only weakly detectable at 3 and 4 dpf and persisted only at the mid-hindbrain boundary (MHB). K, M and O: Arrowheads show staining around the lens in the developing eye. See list for abbreviations. Scale bars: whole mounts: 500 μm, boxed images: 50 μm, enlarged head views: 200 μm. |
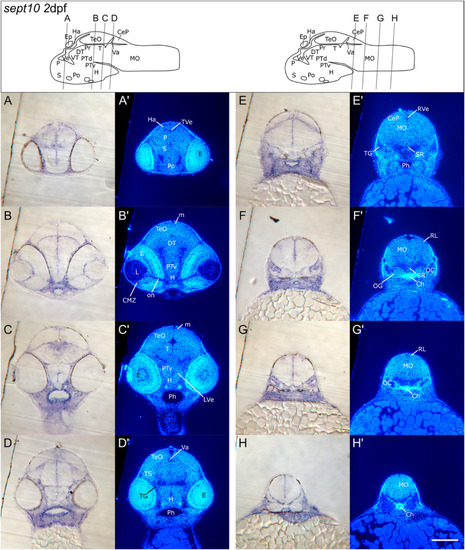
Transverse sections of 2 dpf zebrafish larvae showing detailed sept10 expression in the CNS. A–H: Transverse Epon sections of sept10 labeled 2 dpf zebrafish (A–H). Sections were counterstained with Hoechst 33258 to visualize brain structures (A’ - H′). Cutting levels and angles of the respective sections are illustrated in the brain schemes above. Bright field images show that sept10 expression was localized in ventricular zones as well as in several structures such as pallium (P), subpallium (S in A) and tegmentum (T in C). Sept10 expressing cells were also found around the lens (L), inside the optic nerve (on in B) and in regions of the cerebellar plate (CeP in E). Moreover, sept10 expression was observed in cells of the rhombic lip (RL) and medial in the medulla oblongata (MO) (F–H). Scale bar: 100 μm. See list for abbreviations. Brain schemes were adapted from Mueller and Wullimann, 2016). EXPRESSION / LABELING:
|
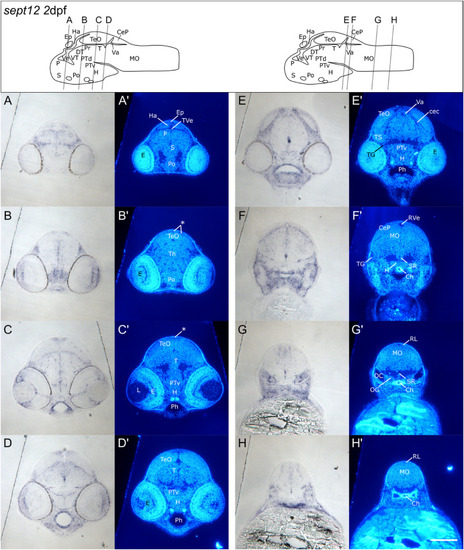
Transverse sections of 2 dpf zebrafish larvae showing detailed sept12 expression in the CNS. A–H: Transverse sections of sept12 labeled 2 dpf zebrafish (A–H). Sections were in addition stained with Hoechst 33258 for better visualization of distinct brain areas (A’ - H′). Level and angle of each section are displayed in the brain scheme above. Bright field images show sept12 expression in cells along the ventricle (A + B) and in several brain regions including habenula (Ha), pallium (P), subpallium (S in A), zones around the lens (L) and in the optic nerve (on in C). Sept12 expression was also visible at a dorsal region of the tectum opticum (TeO) (asterisk), tegmentum (T), hypothalamus (H) and posterior tuberculum ventral part (PTv in D). Furthermore, cells in the cerebellar comissure (cec), cerepellar plate (CeP), torus semicircularis (TS in E − F) and rhombic lip (RL) (G) showed sept12 expression. Prominent sept12 expression was also detected in the superior Raphe nucleus (SR) (F–G). Scale bar: 100 μm. See list for abbreviations. Brain schemes were adapted from Mueller and Wullimann, 2016). EXPRESSION / LABELING:
|
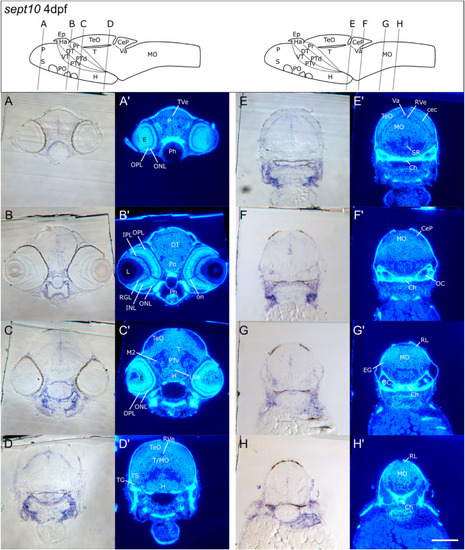
Transverse sections of 4 dpf zebrafish larvae showing detailed sept10 expression in the CNS. A–H: Images of Epon cross sections of 4 dpf zebrafish stained for sept10 transcripts via RNA WISH. Hoechst 33258 staining was used in order to identify single brain regions. Section level and cutting angle are schematically displayed in the drawing above (A′- H′). Note, that the illustration presents the brain scheme of a 5 dpf zebrafish and serve only for rough orientation. Sept10 expression shown in the bright field images was slightly enhanced in ventricular zones (A–C) and particularly prominent in cells at the border of the tectum opticum (TeO) close to the emerging cerebellar plate (CeP in D). Sept10 expression was also detected in cells of the medial medulla oblongate (MO), the otic capsule (OC in F + G) and in ventral mesodermal tissues outside the brain (C–H). Scale bar: 100 μm. See list for abbreviations. Brain schemes were adapted from Mueller and Wullimann, 2016). EXPRESSION / LABELING:
|
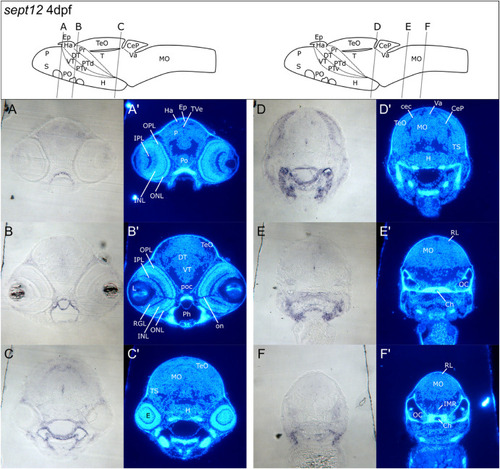
Transverse sections of 4 dpf zebrafish larvae showing detailed sept12 expression in the CNS. A – F: Epon cross sections of sept12 labeled 4 dpf zebrafish. Brain structures were visualized using Hoechst 33258 (A’ – F′). Levels and angles of sections are displayed in the schematic drawing. Note that the brain schemes display 5 dpf brains and serve only for rough orientation. Sept12 expression displayed in bright field images was prominent in cells at the border between tectum opticum (TeO) and cerebellar commissure (cec in C – D) as well as in a cell cluster at the medial ventricle (C–E). Sept12 was expressed in tissue outside the CNS (C–E). Scale bar: 100 μm. See list for abbreviations. Brain schemes were adapted from Mueller and Wullimann, 2016). EXPRESSION / LABELING:
|
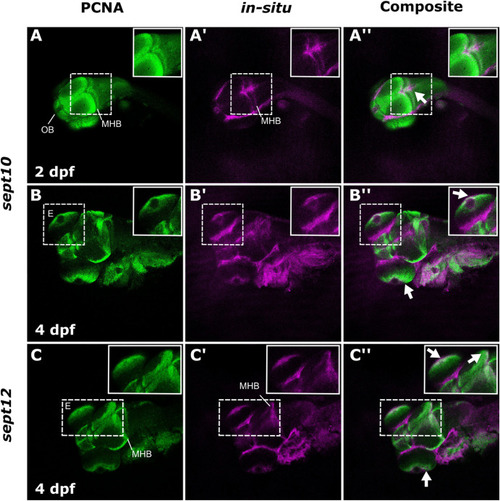
Correlation of sept10 and sept12 expression and PCNA labeling. A – C: PCNA staining of larval zebrafish at the indicated time points. A’ – C’: RNA WISH staining against sept10 or sept12. Note the overlapping of both stainings (indicated by white arrows) in the merged images A’’ – C’‘. The inserts show magnifications of overlapping regions. See list for abbreviations. |
Reprinted from Gene expression patterns : GEP, , Berger, C., Charlotte Kreß, J.K., Helmprobst, F., Sept10 and sept12 are expressed in specific proliferating cells in zebrafish brain, 119387119387, Copyright (2024) with permission from Elsevier. Full text @ Gene Expr. Patterns