
Fig. 1
- ID
- ZDB-FIG-250709-22
- Publication
- Wieloch et al., 2025 - In vitro embryolethality testing during the peri-implantation stage using 3D mouse embryoids: comparison with 2D mouse cell cultures and the zebrafish embryo model
- Other Figures
- All Figure Page
- Back to All Figure Page
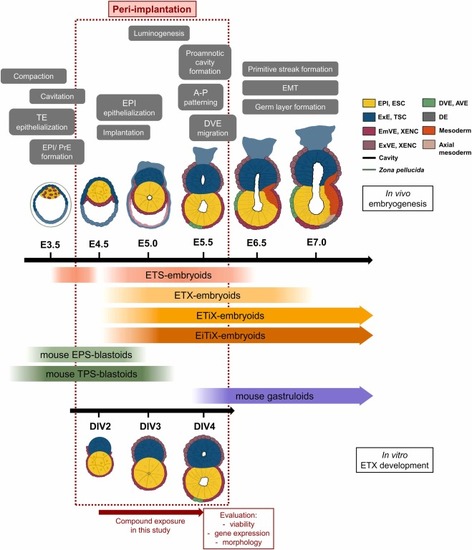
Schematic comparison of in vivo/in vitro developmental timeline. Summary of the early developmental processes of mice embryos in vivo (E3.5–7) and the matching developmental stage of in vitro 3D embryoids, according to [13]. The range of developmental potential of each model (blastoid, embryoid or gastruloid) to cover the developmental processes depicted in gray boxes at the top of the time-lines is indicated by the start and end points of the colored bars. AVE: Anterior visceral endoderm; A-P: Anterior–Posterior; DE: Definitive endoderm; DIV: day in vitro; DVE: Distal visceral endoderm; EmVE: Embryonic visceral endoderm; EMT: Epithelial–mesenchymal transition; EPI: Epiblast; ExE: Extra-embryonic ectoderm; ExVE: Extra-embryonic visercal endoderm; PrE: Primitive endoderm; TE: Trophectoderm. |
Reprinted from Reproductive toxicology (Elmsford, N.Y.), , Wieloch, J., Blanco, J., Zordick, C., Ohnesorge, N., Schneider, M.R., Barenys, M., Knöspel, F., In vitro embryolethality testing during the peri-implantation stage using 3D mouse embryoids: comparison with 2D mouse cell cultures and the zebrafish embryo model, 108941108941, Copyright (2025) with permission from Elsevier. Full text @ Reprod. Toxicol.