
Fig. 3
- ID
- ZDB-FIG-250709-24
- Publication
- Wieloch et al., 2025 - In vitro embryolethality testing during the peri-implantation stage using 3D mouse embryoids: comparison with 2D mouse cell cultures and the zebrafish embryo model
- Other Figures
- All Figure Page
- Back to All Figure Page
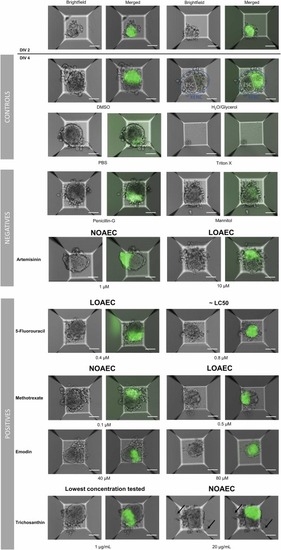
Representative images of embryoid’s morphology after exposure to the controls and to test compounds. Representative pictures of embryoids showing expected or altered morphogenetic events (with respect to in vivo development) in each condition before treatment on DIV2 and after treatment on DIV4. Information on which solvent was used for each compound is summarized in Table 1. NOAEC and LOAEC of each compound tested are depicted, if they could be identified. For 5-fluorouracil and trichosanthin, the LC50 and the lowest tested concentration, respectively, are shown. The scale bar equals 100 µm. Green signal: GFP-expressing trophoblast stem cells (TSC). Pictures of the H2O/Glycerol control showing the representative individual cell compartments (ESC, TSC, XENC). Black arrows indicate disruption of the XENC layer surrounding the embryoid. |
Reprinted from Reproductive toxicology (Elmsford, N.Y.), , Wieloch, J., Blanco, J., Zordick, C., Ohnesorge, N., Schneider, M.R., Barenys, M., Knöspel, F., In vitro embryolethality testing during the peri-implantation stage using 3D mouse embryoids: comparison with 2D mouse cell cultures and the zebrafish embryo model, 108941108941, Copyright (2025) with permission from Elsevier. Full text @ Reprod. Toxicol.