
FIGURE
Fig. 7
- ID
- ZDB-FIG-250709-28
- Publication
- Wieloch et al., 2025 - In vitro embryolethality testing during the peri-implantation stage using 3D mouse embryoids: comparison with 2D mouse cell cultures and the zebrafish embryo model
- Other Figures
- All Figure Page
- Back to All Figure Page
Fig. 7
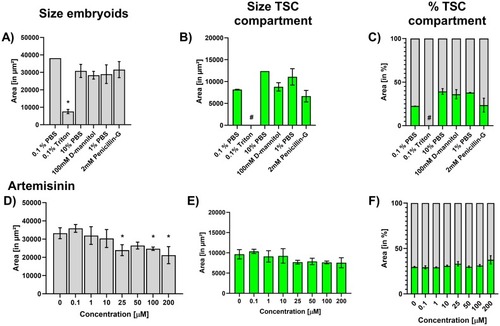
Assessment of the effects of the negative test compounds on embryoid’s morphology. Mean size ( ± SEM) of the whole embryoid area (gray bars in A, D) in µm2, or the TSC compartment (green bars in B, E) in µm2, and the percentage of embryonic area covered by the TSC compartment (C, F) in % of at least three independent experiments. Statistical analysis performed with one-way ANOVA followed by Dunnett post hoc comparison test with a significance threshold established at p < 0.05 (*). # indicates that statistical comparison was not possible because all values were equal to zero. |
Expression Data
Expression Detail
Antibody Labeling
Phenotype Data
Phenotype Detail
Acknowledgments
This image is the copyrighted work of the attributed author or publisher, and
ZFIN has permission only to display this image to its users.
Additional permissions should be obtained from the applicable author or publisher of the image.
Reprinted from Reproductive toxicology (Elmsford, N.Y.), , Wieloch, J., Blanco, J., Zordick, C., Ohnesorge, N., Schneider, M.R., Barenys, M., Knöspel, F., In vitro embryolethality testing during the peri-implantation stage using 3D mouse embryoids: comparison with 2D mouse cell cultures and the zebrafish embryo model, 108941108941, Copyright (2025) with permission from Elsevier. Full text @ Reprod. Toxicol.