|
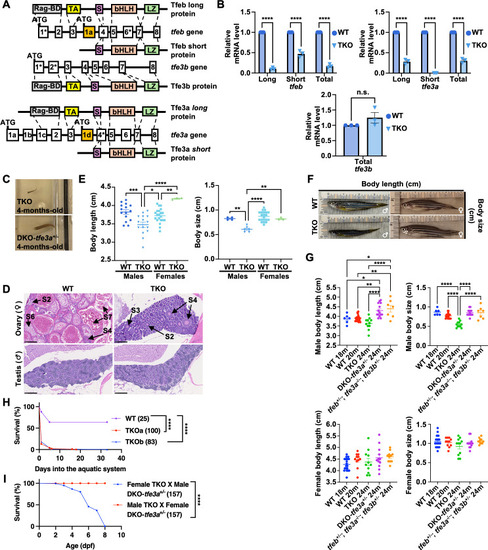
Generation of zebrafish tfeb, tfe3a and tfe3b triple knockout mutants. (A) Genomic coding structure of the zebrafish tfeb, tfe3a and tfe3b genes and schematic illustration of the major structural domains of their different forms. The coding exons targeted in genome-editing using CRISPR/Cas9 have been marked with asterisks, alternative first coding exons are highlighted in orange. Exons/introns are not drawn to the scale. RAG-BD, RAG binding domain; TA, transactivation domain; S, 14-3-3 binding motif; bHLH, beta Helix-Loop-Helix; LZ, leucine zipper domain. (B) Real-time qPCR analysis showing reduction of tfeb, tfe3a and tfe3b expression in 2 dpf TKO embryos. The data represent means ± SEM, n = 3 independent experiments. Statistical significance was determined by using two-way ANOVA with Sidak’s multiple comparisons. n.s., not significant, **** < 0.0001. (C) Representative pictures of a 4-months-old TKO fish (top) and its sibling fish (bottom) in a DC-96 genotyping tank. (D) Comparison of H&E-stained longitudinal sections of WT and TKO 4-months-old fish embedded in paraffin. (Top) Representative pictures of the ovary of TKO small adult female fish showing the lack of mature oocytes in the TKO ovaries. Different stages of primary oocytes (S2, S3, S4, S6 and S7) are indicated. S2, S3 represent the previtellogenic stages; S6 and S7 are the last stages of oocytes maturation. (Bottom) Representative pictures of testis of 4-months-old control and TKO small adult male fish. Scale bars, 250 μm. (E) Comparison of body length (left) and body size (right) between 12-months-old WT and TKO male and female fish. The data represent means ± SEM. Statistical significance was determined by Welch’s two-tailed t-test. * < 0.05, ** < 0.01, *** < 0.001 and **** < 0.0001. (F) Representative pictures of 12-months-old WT and TKO fish used for the quantification in (E). (G) Comparison of body length and size among different males (top panels) and female (bottom panels) adult fish. WT used are 18- and 20-months-old, TKO and their siblings are 24-months-old. The data represent means ± SEM. Statistical significance was calculated using ordinary one-way ANOVA with Tukey’s multiple comparison test, with a single pooled variance. * < 0.05, ** < 0.01, *** < 0.001 and **** < 0.0001. (H) Kaplan-Meier curves showing the percentage of survival (y axis) of WT and TKO embryos (TKOa and TKOb) through time (x axis) while growing into the aquatic system from 6 dpf (time point 0). Numbers in parenthesis indicate the number of embryos used. (Log-rank (Mantel-Cox) test: **** < 0.0001). (I) Representative Kaplan-Meier curves showing the percentage of survival (y axis) of the embryos from two different crosses through time (x axis). Numbers in parenthesis indicate the number of embryos used. (Log-rank (Mantel-Cox) test: **** < 0.0001).
|