|
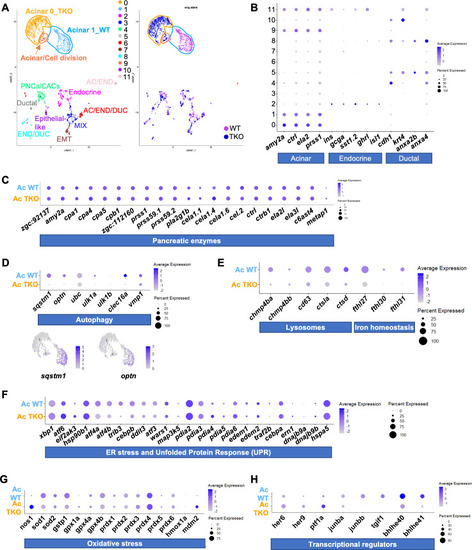
Single cell RNA-sequencing of 4 dpf WT and TKO GFP +cells.(A) (Left) UMAP showing clustering of merged WT and TKO GFP+ datasets. Each cluster identity has been annotated in the plot. Acinar cell clusters have been highlighted. (Right) UMAP displaying the projection of the two genotypes (WT and TKO) merged for the analysis. (B) Dot plots showing the expression of acinar, endocrine and ductal gene markers in merged WT and TKO datasets as shown in (A). (C) Dot plot showing the expression of the pancreatic proteins found downregulated in the proteomic analysis of 5 dpf WT and TKO embryos. (D) (Top) Dot plot showing expression of genes involved in autophagy in TKO and WT acinar cell (Ac) clusters. (Bottom) feature plots depicting the expression level of specific autophagic markers in acinar cell clusters as shown in (A) (purple is high, gray is low). (E-G) Dot plot showing expression in TKO and WT acinar cell (Ac) clusters of genes involved in different cellular processes: lysosomes and iron homeostasis (E), ER stress and UPR (F) and oxidative stress (G). (H) Dot plot showing examples of genes differentially expressed in TKO and WT acinar cells at 4 dpf. In each dot plot, the size of the dots encodes the percentage of cells within a class, the color indicates the average level of expression (purple is high, grey is low). Graphics in S4A Fig were created with BioRender.com.
|