
Fig. 7
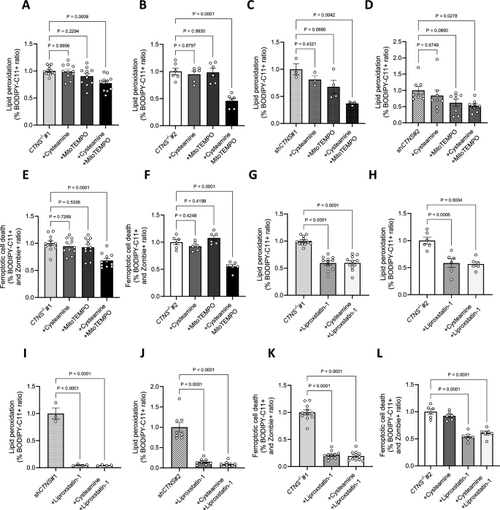
Mitochondrial oxidative stress induces lipid peroxidation in cystinosis podocytes. (a, b, c, d) Ratio of the percentages of BODIPY-C11 + cells measured by flow cytometry incubated with 10 µM cysteamine, 10 µM MitoTEMPO, or 100 µM cysteamine + 10 µM MitoTEMPO for 48 h, normalized to a. CTNS−/−#1, b. CTNS−/−#2, c. shCTNS#1, and d. shCTNS#2. (n ≥ 3 biological experiments, n = 1 technical replicate). Statistical analysis: Dunnett’s One-Way ANOVA. (e, f) Ratio of the percentages of BODIPY-C11 + cells among dead podocytes (Zombie) measured by flow cytometry incubated with 100 µM cysteamine, 10 µM MitoTEMPO, or 100 µM cysteamine + 10 µM MitoTEMPO for 48 h, normalized to e. CTNS−/−#1 and f. CTNS−/−#2. (n ≥ 3 biological experiments, n = 1 technical replicate). Statistical analysis: Dunnett’s One-Way ANOVA. (g, h, i, j) Ratio of the percentages of BODIPY-C11 + cells measured by flow cytometry incubated with 10 µM liproxstatin-1 or 100 µM cysteamine + 10 µM liproxstatin-1 for 48 h, normalized to g. CTNS−/−#1, h. CTNS−/−#2, i. shCTNS#1, and j. shCTNS#2. Data for the CTNS−/−#1, CTNS−/−#2, shCTNS#1, and shCTNS#2 groups are the same as those in (A-D), respectively. (n ≥ 3 biological experiments, n = 1 technical replicate). Statistical analysis: Dunnett’s One-Way ANOVA. (k, l) Ratio of the percentages of BODIPY-C11 + cells among dead podocytes (Zombie) measured by flow cytometry incubated with 10 µM liproxstatin-1 or 100 µM cysteamine + 10 µM liproxstatin-1 for 48 h, normalized to k. CTNS−/−#1 and l. CTNS−/−#2. Data for the CTNS−/−#1 and CTNS−/−#2 groups are the same as those in (e–f), respectively. (n ≥ 3 biological experiments, n = 1 technical replicate). Statistical analysis: Dunnett’s One-Way ANOVA. Each dot represents a biological experiment |