
Fig. 5
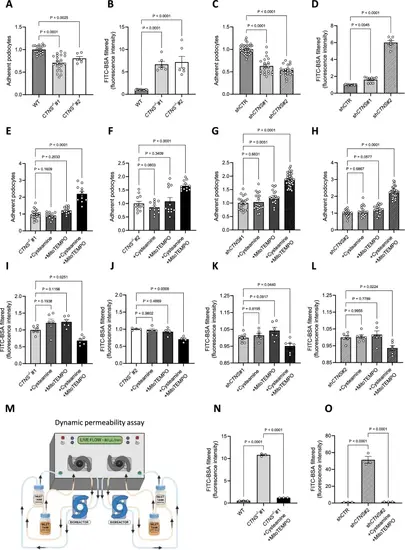
Targeting mitochondrial ROS improves cell adhesion and reduces podocyte permeability. (a) Adherence of CTNS−/−#1 and CTNS−/−#2, normalized to WT podocytes. Each dot represents the relative number of podocytes attached in one well. (n ≥ 3 biological experiments, n ≥ 3 technical replicates). Statistical analysis: linear mixed model. (b) Fluorescein isothiocyanate-labeled bovine serum albumin (FITC-BSA) fluorescence quantification in CTNS−/−#1 and CTNS−/−#2, normalized to WT. (n ≥ 6 biological experiments, n = 4 technical replicates). Statistical analysis: Dunnett’s One-Way ANOVA. (c) Adherence of shCTNS#1 and shCTNS#2, normalized to shCTR. Each dot represents the relative number of podocytes attached in one well. (n ≥ 3 biological experiments, n ≥ 3 technical replicates). Statistical analysis: linear mixed model. (d) FITC-BSA fluorescence quantification in shCTNS#1 and shCTNS#2, normalized to shCTR. (n ≥ 7 biological experiments, n = 4 technical replicates. Statistical analysis: Dunn’s Kruskal–Wallis. (e, f, g, h) Adherence of cells incubated with 100 µM cysteamine, 10 µM MitoTEMPO, or 100 µM cysteamine + 10 µM MitoTEMPO for 48 h, normalized to e. CTNS−/−#1, f. CTNS−/−#2, g. shCTNS#1, and h. shCTNS#2. (n ≥ 3 biological experiments, n ≥ 3 technical replicates). Statistical analysis: linear mixed model. (I, j, k, l) FITC-BSA fluorescence quantification of cells incubated with 100 µM cysteamine, 10 µM MitoTEMPO, or 100 µM cysteamine + 10 µM MitoTEMPO for 48 h, normalized to i. CTNS−/−#1, j. CTNS−/−#2, k. shCTNS#1, and l. shCTNS#2. (n ≥ 4 biological experiments, n ≥ 3 technical replicates). Statistical analysis: Dunnett’s One-Way ANOVA. (m) Millifluidic system to assess podocyte dynamic permeability. Podocytes were seeded in a bioreactor and perfused with media. The figure was created using biorender.com. (n, o) Quantification of FITC-BSA fluorescence intensity in the upper chamber medium after perfusion in n. WT, CTNS−/−#1 + 100 µM cysteamine + 10 µM MitoTEMPO, and o. shCTR, shCTNS#2 + 100 µM cysteamine + 10 µM MitoTEMPO for 48 h. (n ≥ 3 biological experiments, n = 4 technical replicates). Statistical analysis: Dunnett’s One-Way ANOVA. Unless noted, each dot represents a biological experiment |