
Fig. 2
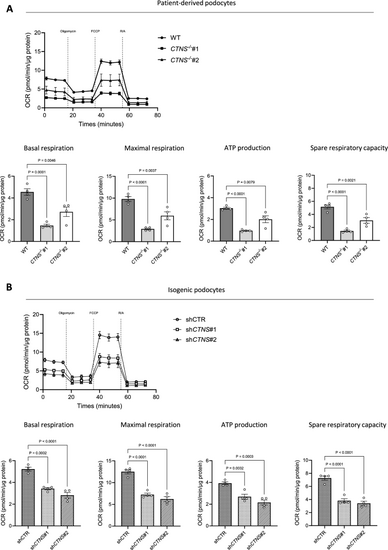
Cystinosis podocytes reveal decreased respiratory activity. Seahorse assay. (a, b) Upper panel: Oxygen consumption rate (OCR) in a. WT, CTNS−/−#1, and CTNS−/−#2, and b. shCTR, shCTNS#1, and shCTNS#2 at baseline and following injection of oligomycin, FCCP, and rotenone/antimycin A (R/A). Final concentrations: oligomycin (1.5 μM), FCCP (2 μM), rotenone (1.25 μM) and antimycin A (2.5 μM). Lower panel: quantification of basal respiration, maximal respiration, ATP production, and spare respiratory capacity in a. WT, CTNS−/−#1, and CTNS−/−#2, and b. shCTR, shCTNS#1, and shCTNS#2 (n = 4 biological experiments, n = 10 technical replicates). Statistical analysis: Dunnett’s one-way ANOVA. For each experiment, values were normalized to protein levels. Each dot represents a biological experiment |