
Fig. 1
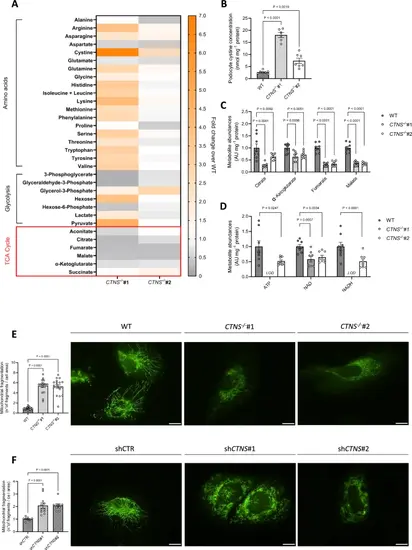
Cystinosis podocytes display impaired mitochondrial metabolism and a fragmented mitochondrial network. a. Intracellular metabolite levels in CTNS−/−#1 and CTNS−/−#2 normalized to WT podocytes measured by LC–MS (n = 3 biological experiments, n ≥ 2 technical replicates). b. Cystine concentrations in WT, CTNS−/−#1, and CTNS−/−#2, expressed as nmol mg⁻1 protein. (n ≥ 6 biological experiments, n = 2 technical replicates). Statistical analysis: Dunnett’s one-way ANOVA. (c, d) c. Citrate, α-ketoglutarate, fumarate, and malate levels in CTNS−/−#1 and CTNS−/−#2, normalized to WT podocytes and protein (mg⁻1), d. ATP, NAD, and NADH levels in CTNS−/−#1 and CTNS−/−#2, normalized to WT podocytes and protein (mg⁻1). (n = 3 biological experiments, n ≥ 2 technical replicates). Statistical analysis: linear mixed model for each metabolite. AU = arbitrary units. LOD = below the limit of detection. Each dot represents a technical replicate. (e, f) Mitochondrial fragmentation in cells expressing the mitochondrial roGFP2 redox sensor. Left panel: quantification of mitochondrial fragmentation (number of fragments normalized to cell area) in e. CTNS−/−#1 and CTNS−/−#2 normalized to WT podocytes; f. shCTNS#1 and shCTNS#2 normalized to shCTR. (n = 4 biological experiments, n ≥ 4 technical replicates). Statistical analysis: linear mixed model. Each dot represents an individual cell measurement. Right panels: representative images of mitochondrial networks. Scale bar: 20 μm. Unless noted, each dot represents a biological experiment |