
Figure 6
- ID
- ZDB-FIG-250320-18
- Publication
- Manickam et al., 2025 - Paving the way for better ototoxicity assessments in cisplatin therapy using more reliable animal models
- Other Figures
- All Figure Page
- Back to All Figure Page
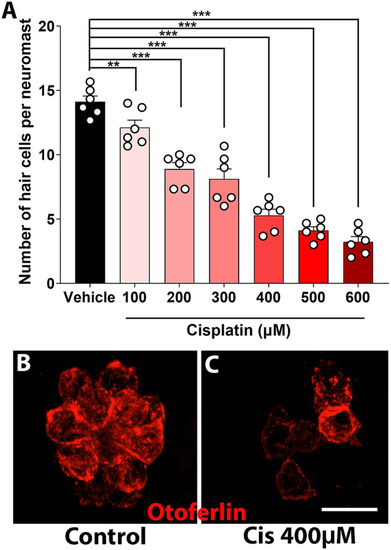
Dose–response curve of clinical cisplatin in zebrafish. |
| Fish: | |
|---|---|
| Condition: | |
| Observed In: | |
| Stage Range: | Day 5 to Day 6 |