
FIGURE
Figure 3
- ID
- ZDB-FIG-250320-15
- Publication
- Manickam et al., 2025 - Paving the way for better ototoxicity assessments in cisplatin therapy using more reliable animal models
- Other Figures
- All Figure Page
- Back to All Figure Page
Figure 3
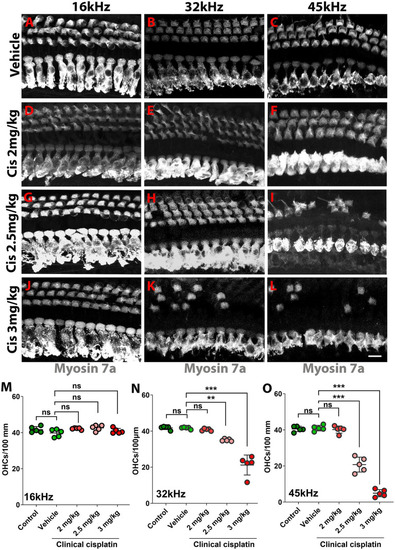
Clinical cisplatin treatment results in hair cell damage. |
Expression Data
Expression Detail
Antibody Labeling
Phenotype Data
Phenotype Detail
Acknowledgments
This image is the copyrighted work of the attributed author or publisher, and
ZFIN has permission only to display this image to its users.
Additional permissions should be obtained from the applicable author or publisher of the image.
Full text @ Front. Cell. Neurosci.