FIGURE

Figure 5

ID
ZDB-FIG-250320-17
Publication
Manickam et al., 2025 - Paving the way for better ototoxicity assessments in cisplatin therapy using more reliable animal models
Other Figures
All Figure Page
Back to All Figure Page
Figure 5

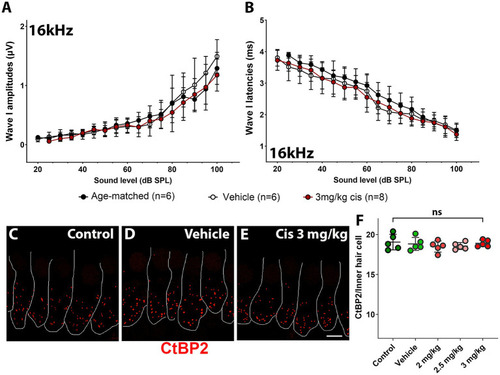
Assessment of clinical cisplatin treatment at the 16 kHz frequency region. Wave I amplitudes (A) and latencies (B) were analyzed for the 16 kHz region in age-matched control animals (black), and animals receiving saline solution (vehicle-control, white) or clinical cisplatin (3 mg/kg b.w., maroon). (C–E) Representative micrographs of the organ of Corti at the 16 kHz frequency region. Pre-synaptic ribbons were immunostained for CtBP2 (red). Hair cells were delineated with white traces. (C) Age-matched control. (D) Vehicle control. (E) Clinical cisplatin 3 mg/kg b.w. Scale bar = 5 μm. (F) Pre-synaptic ribbon quantification at the 16 kHz region for all the groups. Mean +/− SD. Circles represent individual animals. Statistical analysis: One-way ANOVA followed by Dunnett post-test for multiple comparisons. ns, not significant.

Expression Data

Expression Detail
Antibody Labeling
Phenotype Data

Phenotype Detail
Acknowledgments
This image is the copyrighted work of the attributed author or publisher, and ZFIN has permission only to display this image to its users. Additional permissions should be obtained from the applicable author or publisher of the image. Full text @ Front. Cell. Neurosci.