|
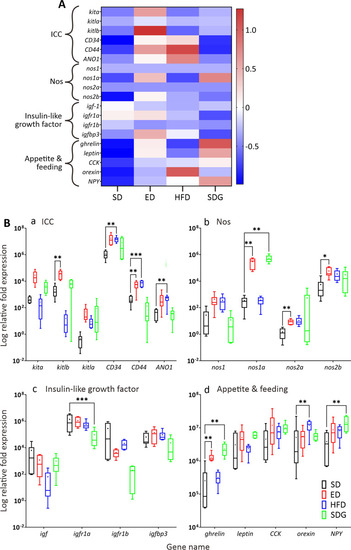
Graphs showing the qPCR data from SD, ED, HFD and SDG larvae at 7 dpf (n = 6 for each). The in heatmap (A) and boxplots (B) data for each gene were normalised and expressed as the relative fold expression compared to β-actin. The expression of genes related to interstitial cells of Cajal (ICC), nitric oxide synthase (Nos), insulin-like growth factor (igf), and appetite and feeding, are shown. In (A), the gene names are shown in italics on the left and the relative expression is indicated using a graded colour-scale, where each gene is assigned a z-score depending on the respective amount of down- (shades of green) or up- (shades of red) regulation between the samples. In (B), medians are shown by horizontal lines inside the boxes, the 25th and 75th percentiles are shown as the bottom and tops of the boxes, and the minimum and maximum values are shown as the small horizontal lines below and above the boxes, and mean values are indicated as “+” sign. Significant differences between the ED, HFD and SDG data and the SD controls were determined using the unpaired t-test (and corrected for multiple comparisons using the Holm-Sidak method), and they are shown as *P<0.05, **P<0.01, and ***P<0.001. N = 6.
|