
Fig 5
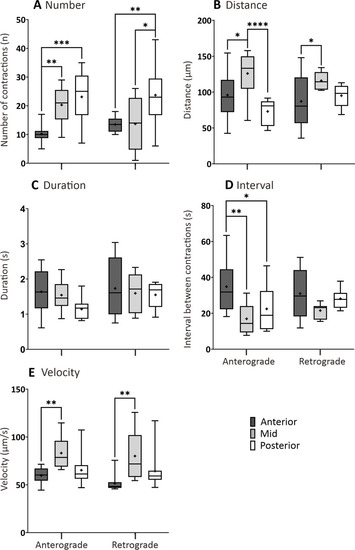
Box plots to show various parameters of GI motility determined from AB larvae at 7 dpf that were fed a standard diet (SD). The following parameters were determined by kymography analysis: (A) number, (B) distance (μm), and (C) duration (s) of contractions, (D) interval between contractions (s), and (E) contraction velocity (μm/s), in both the anterograde and retrograde direction. Medians are shown by horizontal lines inside the boxes, the 25th and 75th percentiles are shown as the bottom and tops of the boxes, and the minimum and maximum values are shown as the small horizontal lines below and above the boxes, and mean values are indicated as “+” sign. Significant differences were determined by two-way ANOVA followed by the Tukey/Sidak multiple comparison test and are presented as * |