FIGURE

Fig 2

ID
ZDB-FIG-241204-10
Publication
Hui et al., 2024 - Imaging analytical technique to assess gastrointestinal motility in vivo using zebrafish larvae with diabetes mellitus-like traits
Other Figures
All Figure Page
Back to All Figure Page
Fig 2

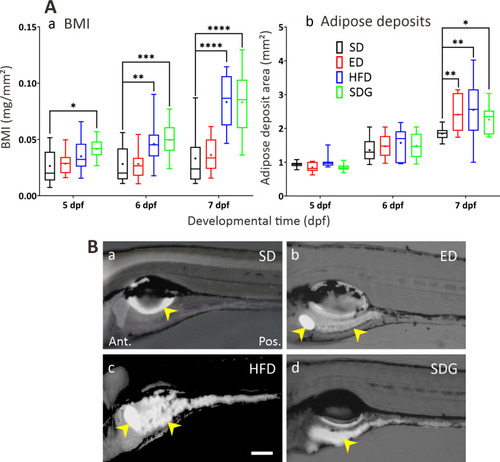
Measurements of body mass index (BMI) and adipose deposits.

(A) Box plots showing the (Aa) BMI (in mg/mm2, n = 21) and (Ab) area of adipose deposits (in mm2, n = 10) measured in zebrafish larvae from 5 dpf to 7 dpf. Both plots show larvae fed a standard diet (SD, controls), or those fed an excess diet (ED), a high-fat diet (HFD), or an SD with immersion in glucose solution at 30 mmol/L (SDG). Medians are shown by horizontal lines inside the boxes, the 25th and 75th percentiles are shown as the bottom and tops of the boxes, and the minimum and maximum values are shown as the small horizontal lines below and above the boxes, and mean values are indicated as “+” sign. Significant differences relative to the SD controls are shown as *P<0.05, **P<0.01, ***P<0.001 and ****P<0.0001, as determined by two-way ANOVA followed by the Dunnett comparison test. (B) Representative fluorescence images of the adipose deposits (yellow arrowheads) found in (Ba) SD controls as well as in the (Bb) ED, (Bc) HFD, and (Bd) SDG models. All images were acquired when the larvae were at 7 dpf. Scale bar: 100 μm. In (Ab) and (B), the adipose deposits were visualised by incubating larvae overnight with BODIPY-FL C5 (0.5 μg/ml).

Expression Data

Expression Detail
Antibody Labeling
Phenotype Data

Phenotype Detail
Acknowledgments
This image is the copyrighted work of the attributed author or publisher, and ZFIN has permission only to display this image to its users. Additional permissions should be obtained from the applicable author or publisher of the image. Full text @ PLoS One