
Fig 7
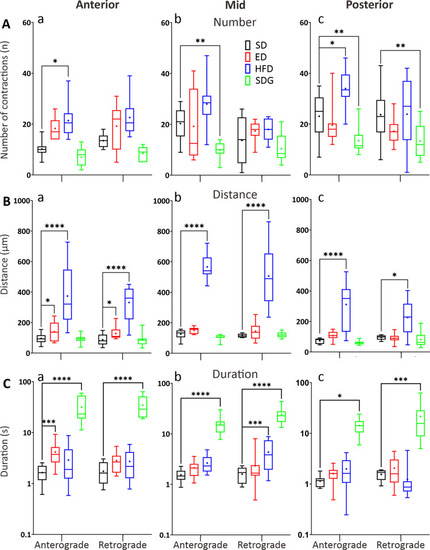
Box plots to show various parameters of GI motility in the anterior, mid, and posterior intestine of ED, HFD and SDG larvae compared with the SD controls, at 7 dpf. The following parameters were determined by kymography analysis: (A) number, (B) distance (μm), and (C) duration (s) of contractions, in both the anterograde and retrograde direction. Medians are shown by horizontal lines inside the boxes, the 25th and 75th percentiles are shown as the bottom and tops of the boxes, and the minimum and maximum values are shown as the small horizontal lines below and above the boxes, and mean values are indicated as “+” sign. Significant differences were determined by two-way ANOVA followed by the Sidak multiple comparison test and are presented as * |