
Fig. EV1
- ID
- ZDB-FIG-241126-32
- Publication
- Ranjan et al., 2024 - SCAR-6 elncRNA locus epigenetically regulates PROZ and modulates coagulation and vascular function
- Other Figures
- All Figure Page
- Back to All Figure Page
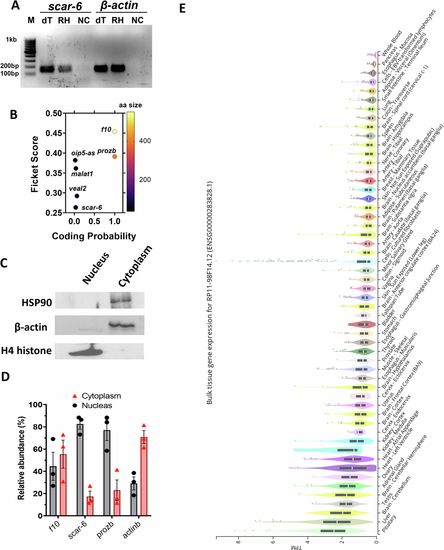
scar-6 lncRNA transcript is ubiquitously expressed and nuclear enriched. (A) Image showing agarose gel electrophoresis of the PCR product derived from scar-6 lncRNA and β-actin, amplified from cDNA synthesized using both oligo dT(dT) and random hexamer primers (RH). (B) Coding potentiality scores were calculated using CPC2 for scar-6 and other lncRNA and protein-coding genes (f10 and prozb). (C) Western blot of HSP90, β-actin and H4 histone to confirm the purity of sub-cellular fractions of zebrafish cells. (D) The bar plot represents the relative abundance of the of scar-6, f10 and prozb in different subcellular fractions quantified using qRT-PCR. The scar-6 and prozb exhibit enrichment in the nucleus fraction and f10 shows equal enrichment in cytoplasm and nucleus. Data from 3 different experiments were plotted as relative abundance percentages ± SEM. (E) The expression profile of human SCAR-6 lncRNA across various tissues, as shown in the GTEx v8 database, is presented in transcripts per million (TPM). The box plot illustrates the data distribution, with the median indicated by a line inside each box, and the 25th and 75th percentiles represented by the lower and upper edges of the box, respectively. Outliers, defined as data points beyond 1.5 times the interquartile range, are also displayed. |