|
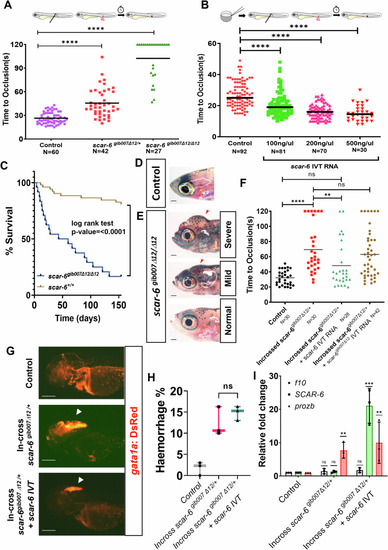
The scar-6 locus exhibits a functional role in the hemostatic process. (A) Coagulation assay plot calculating the time of occlusion (s) in different individual zebrafish in control and progeny of in-cross scar-6gib007Δ12/+ zebrafish performed blinded of the genotype of the animals. Combined data from 3 independent experiments with each point representing the occlusion time of individual zebrafish segregated based on genotype: ****p < 0.0001 (Mann-Whitney U). (B) Coagulation assay plot calculating the time of occlusion (s) in different individual zebrafish in control and different concentration of scar-6 IVT (100, 200, 500 ng/μl) injected embryos performed blinded of the injected concentration. Combined data from 3 independent experiments with each point representing the occlusion time of individual zebrafish segregated based on injected concentration; ****p < 0.0001 (Mann–Whitney U). (C) Survival curve representing survival percentage of closely monitored control (n = 52) and scar-6gib007Δ12/Δ12 (n = 24) zebrafish. p < 0.0001 (log-rank test). (D, E) Representative image at 30 dpf zebrafish of control and scar-6gib007Δ12/Δ12 group closely monitored for survival. The red arrowhead indicates haemorrhage and cranial edema in scar-6gib007Δ12/Δ12 mutant animals. 1.5× magnification scale bar = 200 μm. (F) Coagulation assay plot calculating the time of occlusion (s) in different individual zebrafish in control, in-cross progeny of scar-6gib007Δ12/+, in-cross progeny of scar-6gib007Δ12/+ injected with WT scar-6 IVT RNA(100 ng/μl) and in-cross progeny of scar-6gib007Δ12/+ injected with scar-6gib007Δ12 IVT RNA(100 ng/μl) performed blinded. Each point representing the occlusion time of individual zebrafish segregated based on injected concentration; ns, not significant, **p < 0.01, ****p < 0.0001 (Mann-Whitney U). (G) Representative image of the cranial region of zebrafish at 3 dpf of control wild-type, in-cross progeny of scar-6gib007Δ12/+ and in-cross progeny of scar-6gib007Δ12/+ injected with WT scar-6 IVT RNA(100 ng/μl). The white arrowhead denotes haemorrhage in the animals. 2.5× magnification scale bar = 200 μm. (H) Box and whisker plot representing the percentage of animals from control wild-type, in-cross of scar-6gib007Δ12/+ zebrafish and, in-cross of scar-6gib007Δ12/+ + scar-6 IVT RNA (100 ng/μl) exhibiting haemorrhage phenotype. Data from 3 independent experiments are represented by boxes indicating the interquartile range (25th to 75th percentiles), with the horizontal line within each box denoting the median. Whiskers extend to 1.5 times the interquartile range to define the minimum and maximum values, while individual points represent data from each experiment; ns, not significant (two-tailed unpaired t-test). (I) Relative fold change expression of scar-6, f10, and prozb when compared between control wild-type, scar-6gib007Δ12/Δ12 animals and scar-6gib007Δ12/Δ12 + scar-6 IVT RNA (100 ng/μl) animals. Data from 3 independent biological replicates plotted as mean fold change ± standard deviation; ns, not significant; **p < 0.01, ***p-value ≤ 0.001 (two-tailed unpaired t-test). Source data are available online for this figure.
|