|
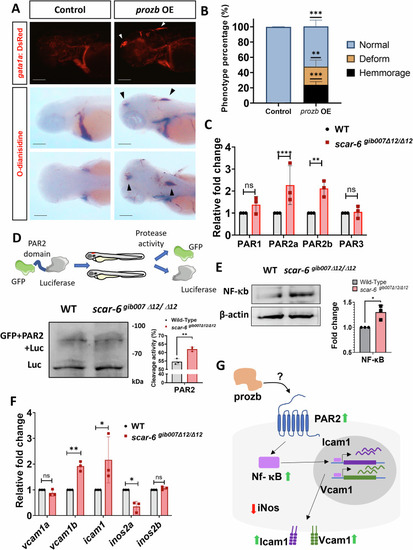
Prozb mediated endothelial cells activation via the PAR2-NF-kb pathway in scar-6gib007Δ12/Δ12 mutants. (A) Representative image showing fluorescence for blood (gata1a:DsRed) in the cranial region of 3 dpf zebrafish and o-dianisidine stating of RBC blood cells in control and prozb IVT RNA (80 ng/μl) injected zebrafish. Black and white arrowhead denotes hemmorage in the animals. 4× magnification scale bar = 200 μm. (B) Stacked bar plot representing the phenotypic percentage of animals with haemorrhage and trunk deformities observed in control and prozb IVT RNA (80 ng/μl) injected zebrafish. Data from 3 independent biological replicates plotted as mean percentage ± standard deviation. **p < 0.01, ***p < 0.001 (unpaired two-tail t-test). (C) Bar plot representing relative fold change in expression of different PAR receptors (PAR1, PAR2a/b and PAR3) when compared between wild type and scar-6gib007Δ12/Δ12 mutant zebrafish. The PAR2a/b receptors expression levels were ~2 fold upregulated in scar-6gib007Δ12/Δ12 mutant zebrafish. Data from 3 independent biological replicates plotted as mean fold change ± standard deviation; ns, not significant, **p < 0.01, ****p < 0.0001 (two-tailed unpaired t-test). (D) Schematic representation of in-vivo PAR2 protease assay performed using eGFP-PAR2 domain-luciferase construct upon injecting into wild type and scar-6gib007Δ12/Δ12 mutant zebrafish followed by western blotting with luciferase antibody. The bar plot represents the quantification of cleavage activity in the wild type and scar-6gib007Δ12/Δ12 mutant zebrafish using the immunoblot quantification data. Data from 3 independent biological replicates plotted as mean ± standard deviation; **p < 0.01 (two-tailed unpaired t-test). (E) Western blot of NF-kB in wild type and scar-6gib007Δ12/Δ12 mutant zebrafish. The bar plot represents the quantification of the western blot from 3 independent biological replicates plotted as mean fold change ± standard deviation. *p < 0.05 (two-tailed unpaired t-test). (F) Bar plot representing relative fold change expression of vcam1a, vcam1b, icam1, inos2a, and inos2b when compared between wild type and scar-6gib007Δ12/Δ12 mutant zebrafish. Data from 3 independent biological replicates plotted as mean fold change ± standard deviation; ns, not significant, *p < 0.05, **p < 0.01 (two-tailed unpaired t-test). (G) Hypothetical schematic of prozb mediated endothelial cell activation through activation of PAR2-NF-κB pathway leading to upregulation of surface adhesion molecules (Icam1 and Vcam1) and downregulation of iNOS2a causing vascular dysfunction and haemorrhage in zebrafish. Source data are available online for this figure.
|