|
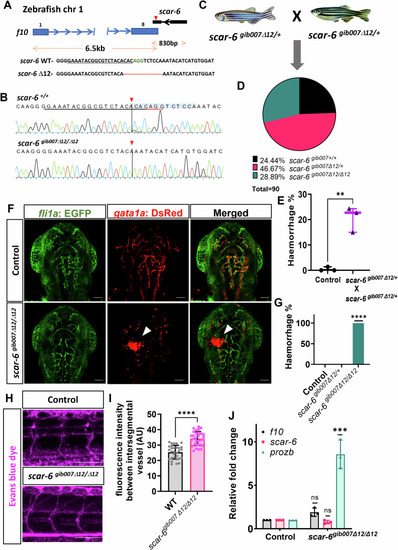
scar-6gib007Δ12/Δ12 mutant exhibits permeability defect with haemorrhage phenotype. (A) CRISPR-Cas9 mediated editing of scar-6 locus at exon 2 resulting in a stable 12-bp deletion zebrafish line named scar-6gib007Δ12. (B) Chromatogram representing the sequence of wild type and homozygous mutant of scar-6gib007Δ12. (C) Schematic representing in-cross of scar-6gib007Δ12/+ zebrafish. (D) Pie chart representing mutation segregation of the progeny from in-cross of scar-6gib007Δ12/+ zebrafish. The genotype of the progeny followed the Mendelian ratio. (E) Box and whisker plot representing the percentage of animals from the in-cross of scar-6gib007Δ12/+ zebrafish exhibiting haemorrhage phenotype compared to wild-type control animals. Data from 3 independent in-cross of scar-6gib007Δ12/+ zebrafish are represented by boxes indicating the interquartile range (25th to 75th percentiles), with the horizontal line within each box denoting the median. Whiskers extend to 1.5 times the interquartile range to define the minimum and maximum values, while individual points represent data from each experiment; **p = 0.0023 (two-tailed unpaired t-test). (F) Representative image showing the cranial region of 3 dpf zebrafish wild-type gib004Tg(fli1a:EGFP;gata1a:DsRed) and scar-6gib007Δ12/Δ12 zebrafish. The white arrowhead denotes haemorrhage in the animals. 40× magnification ; scale bar = 100 μm. (G) Bar plot representation of hemorrhage phenotype associated with genotyped scar-6gib007Δ12/+ in-crossed zebrafish animals. Data from 3 independent in-cross of scar-6gib007Δ12/+ zebrafish experiment plotted as mean percentage ± standard deviation. ****p-value ≤ 0.0001 (unpaired two-tail t-test). (H) Representative image showing intersegmental vessels (ISV) of 3 dpf wild-type and scar-6gib007Δ12/Δ12 zebrafish injected with Evans blue dye. 20× magnification; scale bar = 100 μm. (I) Quantitative analysis of vascular permeability in wild-type and scar-6gib007Δ12/Δ12 zebrafish injected with Evans blue dye. Data of 10 different ROI from 4 individual zebrafish from each wild-type and scar-6gib007Δ12/Δ12 zebrafish plotted as mean ± standard deviation; ****p-value ≤ 0.0001 (Mann–Whitney U). (J) Bar plot representing relative fold change in expression levels of f10, scar-6 and prozb between wild-type and scar-6gib007Δ12/Δ12 zebrafish. The prozb expression levels were 8-fold increase in the scar-6gib007Δ12/Δ12 zebrafish compared to the wild-type. Data from 3 independent biological replicates plotted as mean fold change ± standard deviation; ***p-value ≤ 0.001 (unpaired two-tail t-test). Source data are available online for this figure.
|