
Figure 6
- ID
- ZDB-FIG-241017-57
- Publication
- Massoz et al., 2024 - Negative cell cycle regulation by calcineurin is necessary for proper beta cell regeneration in zebrafish
- Other Figures
- All Figure Page
- Back to All Figure Page
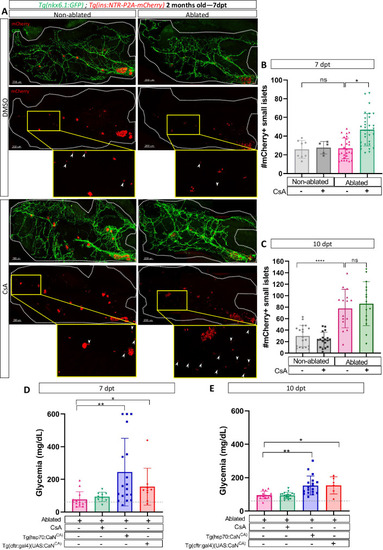
Calcineurin (CaN) regulation is important in juveniles/adults and necessary for correct glycemia recovery. (A) Whole mount fluorescent immunohistochemistry (GFP and mCherry) of the pancreas of Tg(ins:NTR-P2A-mCherry); Tg(nkx6.1:GFP) 2-month-old zebrafish at 7 dpt. 3D projection (stack) of non-ablated and ablated larvae treated with DMSO or Cyclosporin A (CsA) representative samples. The principal islet (PI) and the pancreatic tail are shown. Zoom from section of the pancreatic tail are shown, arrows point out mCherry+ beta cells in these zoom. Scale 200 µM. (B–C) Barplot representing the number of number of mCherry+ small secondary islets (≤5 cells) in the pancreatic tail of Tg(ins:NTR-P2A-mCherry); Tg(nkx6.1:GFP) 2-month-old zebrafish at 7 (B) and 10 dpt (C). The gray spheres represent non-ablated condition (n=8; 18); the pink triangles represent the ablated condition (n=27; 15); the black squares CsA condition (n=5; 17), and inverted green triangles ablated + CsA condition (n=30; 15). Data are presented as mean values ± standard deviation (SD). Two-way ANOVA with Tukey’s multiple comparison test, *p-value <0.05, ****p-value <0.00005. The experiment was performed at least two times and the data are combined in the graph. (D–E) Barplot representing the glycemia (mg/dl) of Tg(ins:NTR-P2A-mCherry); adult zebrafish at 7 (D) and 10 dpt (E). The pink triangles represent the ablated condition (n=13; 14); the inverted green triangles ablated + CsA condition (n=9; 17); the blue squares Tg(hsp70:CaNCA) after heat-shocks (n=17; 18); the orange lozenges Tg(UAS:CaNCA); Tg(cftr:gal4) (n=9; 6). The gray line represents the mean glycemia of controls (non-ablated) fish. Data are presented as mean values ± SD. One-way ANOVA with Tukey’s multiple comparison test, *p-value <0.05; **p-value <0.005. Experiment performed in one technical replicate with several biological replicates (n visible on the graph). |