FIGURE

Figure 2—figure supplement 1.

ID
ZDB-FIG-241017-51
Publication
Massoz et al., 2024 - Negative cell cycle regulation by calcineurin is necessary for proper beta cell regeneration in zebrafish
Other Figures
All Figure Page
Back to All Figure Page
Figure 2—figure supplement 1.

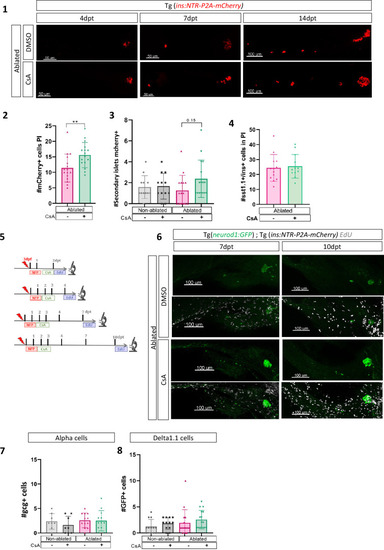
Calcineurin inhibition with Cyclosporin A (CsA) increases the ductal regenerative response.

(1) Whole mount fluorescent immunohistochemistry (mCherry) of the pancreas of Tg(ins:NTR-P2A-mCherry) larvae at 4–7 and 14 dpt. 3D projection (stack) of ablated larvae treated with DMSO or CsA representative samples. The principal islet (PI) and the pancreatic tail are shown. Scale 50 or 100 µM. Barplot representing the number of mCherry+ beta cells in the PI (n=16) (2) and the number of secondary islets of mCherry+ beta cells in the pancreatic tail (n=12 for non ablated and n=16 for ablated conditions) (3) of Tg(ins:NTR-P2A-mCherry); Tg(nkx6.1:GFP) larvae at 10 dpt. Data are presented as mean values ± standard deviation (SD). T-test or two-way ANOVA with Tukey’s multiple comparison test. **p-value <0.005. The experiment was performed at least two times. (4) Barplot representing the number of sst1.1+ mCherry+ bi-hormonal cells in the PI of Tg(ins:NTR-P2A-mCherry);Tg(sst1.1:GFP) larvae at 6 dpt (n=13). Data are presented as mean values ± SD. T-test. The experiment was performed at least two times. (5) Experimental design for 5‐ethynyl‐2′‐deoxyuridine (EdU) assay in larvae. After nifurpirinol (NFP) treatment for 3 to 4 dpf, larvae were exposed to EdU before fixation for analysis. (6) Whole mount fluorescent immunohistochemistry (GFP and EdU) of the pancreas of Tg(ins:NTR-P2A-mCherry); Tg(neurod1:GFP) larvae at 2–4–7 and 10 dpt. 3D projection (stack) of non-ablated and ablated larvae treated with DMSO or CsA representative samples. The PI and the pancreatic tail are shown. Scale 50 µM. Barplot representing the number of gcg+ alpha cells (7); the number of GFP+ sst1.1 delta cells (8); of Tg(ins:NTR-P2A-mCherry); Tg(sst1.1:GFP) larvae at 10 dpt. Gcg was detected by immunohistochemistry (IHC). The gray spheres represent non-ablated condition (n=8;12); the pink triangles represent the ablated condition (n=12;16); the black squares CsA condition (n=8,12) and inverted green triangles ablated + CsA condition. Data are presented as mean values ± SD. Two-way ANOVA with Tukey’s multiple comparison test. **p-value <0.005. The experiment was performed at least two times.

Expression Data

Expression Detail
Antibody Labeling
Phenotype Data

Phenotype Detail
Acknowledgments
This image is the copyrighted work of the attributed author or publisher, and ZFIN has permission only to display this image to its users. Additional permissions should be obtained from the applicable author or publisher of the image. Full text @ Elife