FIGURE

Figure 4—figure supplement 1.

ID
ZDB-FIG-241017-54
Publication
Massoz et al., 2024 - Negative cell cycle regulation by calcineurin is necessary for proper beta cell regeneration in zebrafish
Other Figures
All Figure Page
Back to All Figure Page
Figure 4—figure supplement 1.

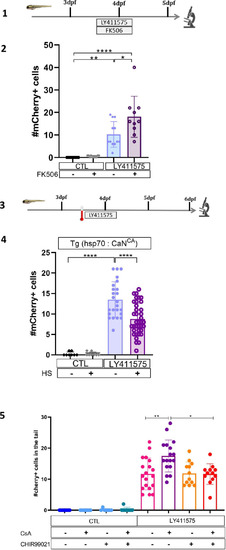
Calcineurin (CaN) repression potentializes the effect of Notch inhibition on beta cell formation.

(1) Experimental design for Notch inhibition test in non-ablated condition. Larvae were treated concomitantly with LY411575 (Notch inhibitor) and FK506 from 3 to 4 dpf and were fixed and analyzed at 5 dpf. (2) Barplot representing the mean number of mCherry+ beta cells in the pancreatic tail of Tg(ins:NTR-P2A-mCherry); Tg(nkx6.1:GFP) larvae at 5 dpf. The black dots represent the control; gray FK506 treatment; blue LY411575; and purple combination of LY411575 and FK506. Data are presented as mean values ± standard deviation (SD). Two-way ANOVA with Tukey multiple comparison test, *p-value <0.05,**p-value <0.005, ****p-value <0.00005. (3) Experimental design for Notch inhibition test in non-ablated condition. Larvae were heat-shocked and then directly treated with LY411575 (Notch inhibitor) from 3 to 4 dpf and were fixed and analyzed at 6 dpf. (4) Barplot representing the mean number of mCherry+ beta cells in the pancreatic tail of Tg(hsp70:CaNCA); Tg(ins:NTR-P2A-mCherry); Tg(nkx6.1:GFP) larvae at 5 dpf. The black dots represent the control; gray heat-shock; blue LY411575; and purple combination of LY411575 and heat-shock. Data are presented as mean values ± SD. Two-way ANOVA with Tukey multiple comparison test, ****p-value <0.00005. (5) Barplot representing the mean number of mCherry+ beta cells in the pancreatic tail of Tg(ins:NTR-P2A-mCherry); Tg(nkx6.1:GFP) larvae at 6 dpf after Notch inhibition (LY411575), CaN inhibition (Cyclosporin A, CsA), and NFATc inhibition (CHIR99021). Data are presented as mean values ± SD. Two-way ANOVA with Tukey multiple comparison test, *p-value <0.05, **p-value <0.005, ****p-value <0.00005.

Expression Data

Expression Detail
Antibody Labeling
Phenotype Data

Phenotype Detail
Acknowledgments
This image is the copyrighted work of the attributed author or publisher, and ZFIN has permission only to display this image to its users. Additional permissions should be obtained from the applicable author or publisher of the image. Full text @ Elife