
Figure 1
- ID
- ZDB-FIG-241017-48
- Publication
- Massoz et al., 2024 - Negative cell cycle regulation by calcineurin is necessary for proper beta cell regeneration in zebrafish
- Other Figures
- All Figure Page
- Back to All Figure Page
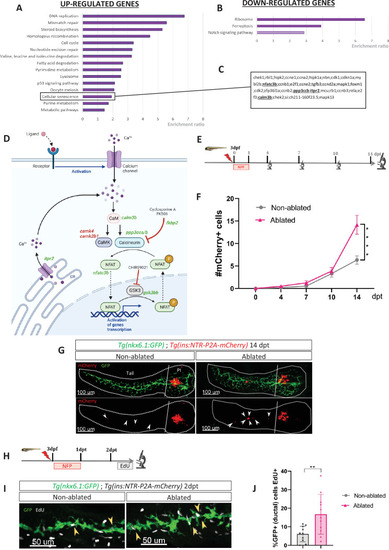
Transcriptomic profiling of ductal cells during beta cell regeneration and validation in larvae. (A, B) Enrichment ratio of selected non-redundant signatures of Kyoto Encyclopedia of Genes and Genomes (KEGG) pathways overrepresented in ductal cells after beta cells ablation (UP – A and DOWN – B) compared to ductal cells without beta cells ablation. Gene Ontology (GO) terms were identified using over-representation analysis (ORA) analysis by WebGestalt using the list of differentially expressed (DE) genes provided by DESeq. The light color for Notch pathway means p-value = 0.11. (C) List of genes associated with the signature of cellular senescence from A and B. Genes related to calcineurin (CaN) pathway are in bold. (D) CaN canonical pathway with upregulated genes in green and downregulated genes in red in transcriptomic data from A and B. (E) Experimental design for regeneration test in larvae. Briefly, after nifurpirinol (NFP) treatment from 3 to 4 dpf, larvae were fixed and analyzed at 4–7–10 and 14 days post treatment (dpt). (F) Graph representing the mean number of mCherry+ beta cells in the pancreatic tail of Tg(ins:NTR-P2A-mCherry); Tg(nkx6.1:GFP) at 0–4–7–10 and 14 dpt. The gray spheres represent non-ablated conditions and the pink triangles the ablated condition. Data are presented as mean values ± SEM. One-way ANOVA test with Tukey’s multiple comparison test, ****p-value <0.0005. The experiment was performed at least two times and the data were combined in this graph. (G) Whole mount fluorescent immunohistochemistry (GFP and mCherry) of the pancreas of Tg(ins:NTR-P2A-mCherry); Tg(nkx6.1:GFP) larvae at 14 dpt. 3D projection (stack) of one non-ablated and one ablated representative samples. The principal islet (PI) and the pancreatic tail are shown. Arrows point out mCherry+ beta cells in the pancreatic tail. Scale 100 µM. (H) Experimental design for 5‐ethynyl‐2′‐deoxyuridine (EdU) assay in larvae. After NFP treatment for 3 to 4 dpf, larvae were exposed to EdU at 2 dpt before fixation for analysis. (I) Whole mount fluorescent immunohistochemistry (GFP and EdU) of the pancreatic tail of Tg(ins:NTR-P2A-mCherry); Tg(nkx6.1:GFP) larvae at 2 dpt. 3D projection (stack) of one non-ablated and one ablated representative samples. Arrows point out GFP+ duct cells EdU+ in the pancreatic tail. Scale 50 µM. (J) Barplot representing the percentage of GFP+ ductal cells which incorporated EdU+ in non-ablated (n=10) and ablated conditions (n=11). Data are presented as mean values ± standard deviation (SD). T-test. **p-value <0.005. The experiment was performed at least two times. |