
Fig. 2
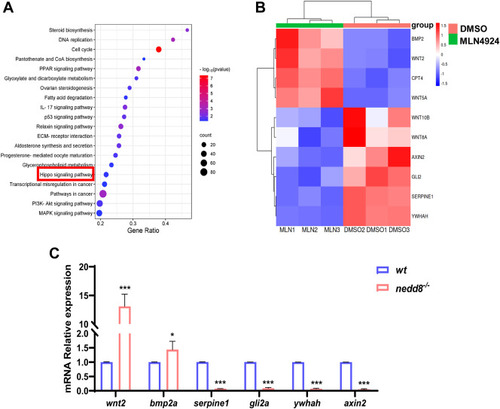
Bioinformatic analysis of differentially expressed genes in rabbit ovarian GCs treated with DMSO or MLN4924. A, representative KEGG enrichment results of differentially expressed genes between rabbit ovarian GCs of DMSO and MLN4924 treatment, respectively. The data point size indicates the number of enriched genes. | log2 FoldChange | >1.5 and p value <0.05 are set as screening criteria. B, expression heatmap of DEGs in the Hippo pathway. Red represents increased gene expression, while blue represents decreased gene expression. The color legend shows the FPKM values each represents. C, qPCR analysis of DEGs related to Hippo pathway in zebrafish. Data are expressed as mean ± SD, n = 3 experiments. ∗p < 0.05, ∗∗p < 0.01, and ∗∗∗p < 0.001, using unpaired Student’s t test. DEG, differentially expressed gene; DMSO, dimethyl sulfoxide; FPKM, fragments per kilobase million; GC, granulosa cell; KEGG, Kyoto encyclopedia of genes and genomes; ns, not significant; qPCR, quantitative real-time PCR. |