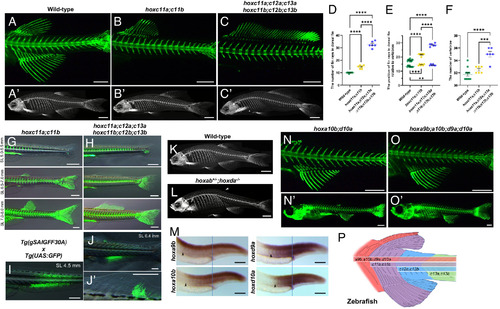
The regions competent for the formation of zebrafish dorsal and anal fins are encompassed by hox genes. (A–C) Calcein staining was used to visualize the skeletons of juvenile fish (SL 7.5 mm to 8.5 mm). (Scale bar, 500 μm.) (A’–C’) X-ray micro-CT scans of adult fish. 3D movies are provided in Movies S7 and S8. (Scale bar, 3 mm.) (D) Comparison of the number of fin rays in the dorsal fin. (E) Comparison of the anterior and posterior ends of the vertebrae attached to the fin rays of the dorsal fin through the radials. The anterior end of the vertebra is marked with a circle, and the posterior end is marked with a rectangle. (F) Comparison of the number of vertebrae. Statistical analysis was performed using data collected from six calcein-stained juvenile fish. The Tukey–Kramer test was conducted. **P < 0.01, ***P < 0.001, and ****P < 0.0001. (G and H) The finfold to fin formation in hoxc11a;c11b and hoxc11a;c12a;c13a;c11b;c12b;c13b mutants (n = 4 for each mutant). Brightfield and calcein-stained images are merged. (Scale bar, 500 μm.) (I and J) Expression pattern of GFP signals in Tg(gSAIGFF30A); Tg(UAS:GFP) larvae. (Scale bar, 250 mm.) (K and L) Micro-CT scan images of WT and hoxab+/−;hoxda−/− cluster mutant fish. (Scale bar, 3 mm.) (M) Expression patterns of hoxab and hoxda genes in 30 hpf WT embryos. The dashed line indicates the position of the cloaca, and the arrowhead indicates the anterior border of the hox expression in the somites. (Scale bar, 100 mm.) (N and O) Skeletons were visualized by calcein staining in hoxa10b;d10a and hoxa9b;a10b;d9a;d10a mutant juvenile fish. (Scale bar, 500 μm.) (P) Models of how multiple hox genes define regional identities in the zebrafish posterior body, including the dorsal and anal fins.
|
