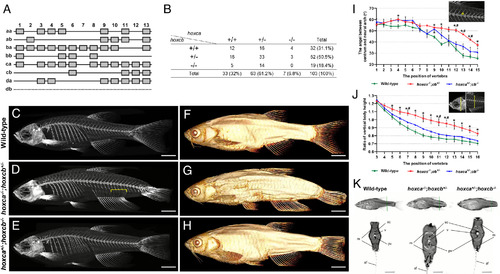
Zebrafish hoxca−/−;hoxcb+/− mutants retain more anterior features in the posterior body. (A) Zebrafish possess 49 hox genes in seven hox clusters. hox clusters such as hoxaa and hoxab were duplicated by TS-WGD. (B) Genotyping of juvenile fish at 1 to 2 mo of age obtained from several intercrosses of hoxca+/−;hoxcb+/− fish. (C–H) Micro-CT scan images of WT fish (n = 3), hoxca−/−;hoxcb+/− mutants (n = 4), and hoxca+/−;hoxcb−/− mutants (n = 3). The images show the whole skeleton (C–E) and the surface structure (F–H) of the fish. In hoxca−/−;hoxcb+/− mutants, the radials connecting the vertebrae to the rays of the anal fin are elongated in a different direction than normal, as indicated by the bracket in (D). The average number of the fin ray is 15.3 in WT, 18.0 in hoxca−/−;hoxcb+/−, and 14.7 in hoxca+/−;hoxcb−/−fish. The average number of the radial is 12.3 in WT, 17.8 in hoxca−/−;hoxcb+/−, and 12.7 in hoxca+/−;hoxcb−/−fish. Movies S1 and S2 are available. (Scale bar, 3 mm.) (I and J) Comparison of the angle between the neural arch and the centrum (I) and the vertical body height (J). The measurements are briefly shown in the Upper Right diagrams. For more information, see Materials and Methods. The position of the vertebra connecting to the most anterior fin ray of the anal fin via the radial is defined as 1. Multiple comparison analysis was performed using the Tukey–Kramer test. Significant differences (P < 0.05) between WT and hox mutants are indicated with *. Significant differences (P < 0.05) between the two hox cluster-deficient mutants are indicated by #. (K) CT sections showing the internal structures. Transverse sections of each mutant are shown at a position indicated by the vertical line corresponding to vertebra 10 in (I and J). Continuous transverse CT sections of the trunk and tail are shown in Movie S3. (Scale bar, 1 mm.) af: anal fin, m: myotome, sc: spinal cord, pv: posterior vein, v: vertebra.
|
