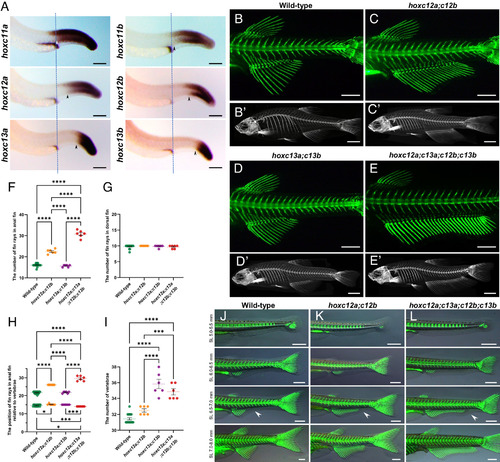
The regional identities posterior to the zebrafish anal fin are defined stepwise by hoxc12 and hoxc13. (A) Expression patterns of hoxc11-13 genes in 30 hpf embryos. The dashed line indicates the position of the cloaca, and the arrowhead indicates the anterior border of hox expression in the somites. (Scale bar, 100 μm.) (B–E) Skeletons of juvenile and adult fish. Calcein staining was used to visualize the skeletons of juvenile fish (SL 7.5 to 8.5 mm; n = 6 for each mutant). (Scale bar, 500 μm.) (B’-E’) X-ray micro-CT scans of adult fish (n = 3 for each mutant). 3D movies are available with Movies S4–S6. (Scale bar, 3 mm.) (F and G) Comparison of the number of fin rays in the anal fin (F) and dorsal fin (G). (H) Comparison of the anterior and posterior ends of vertebrae attached to the fin rays of the anal fin (H) through the radials. The anterior end of the vertebra is marked with a circle, and the posterior end is marked with a rectangle. (I) Comparison of the number of vertebrae. Statistical analysis was performed using data collected from six calcein-stained juvenile fish. The Tukey–Kramer test was performed with *P < 0.05, **P < 0.01, ***P < 0.001, and ****P < 0.0001. (J–L) The finfold to fin formation in each mutant (n = 4 for each mutant). Brightfield and calcein-stained images are merged. Arrowheads indicate the anteriormost part of the ventral finfold where regression was observed. (Scale bar, 500 μm.)
|
