FIGURE

Figure 3

ID
ZDB-FIG-240620-193
Publication
Arefanian et al., 2024 - Unraveling Verapamil's Multidimensional Role in Diabetes Therapy: From β-Cell Regeneration to Cholecystokinin Induction in Zebrafish and MIN6 Cell-Line Models
Other Figures
All Figure Page
Back to All Figure Page
Figure 3

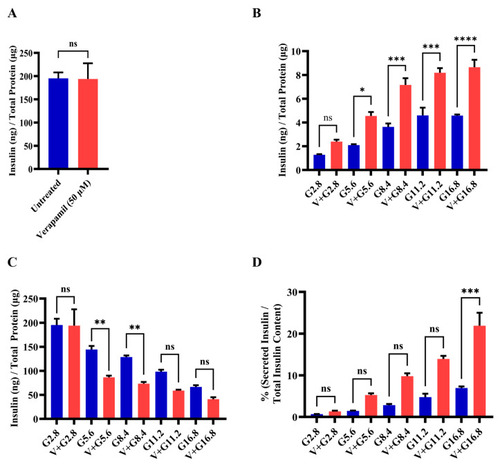
Functional effect of verapamil on the insulin content and glucose stimulated-insulin secretion (GSIS) rate of MIN6 cells. (A) Measured insulin content in MIN6 cells treated with 50 µM verapamil (red) for 24 h or left untreated (blue). (B) Total secreted insulin by MIN6 cells and (C) total insulin content in MIN6 cells when stimulated with different concentrations of glucose and either treated with 50 µM verapamil (red) for 24 h or left untreated (blue). (D) Percentage of secreted insulin over total insulin content of each condition. Each experiment was performed in 4 independent repeats. Difference between the groups was statistically analyzed using two-way analysis of variance (ANOVA), and p-values < 0.05 were considered statistically significant. Data are presented as mean ± SEM; * p-value < 0.05; ** p-value < 0.01; *** p-value < 0.001; and **** p-value < 0.0001, ns: non-significant.

Expression Data

Expression Detail
Antibody Labeling
Phenotype Data

Phenotype Detail
Acknowledgments
This image is the copyrighted work of the attributed author or publisher, and ZFIN has permission only to display this image to its users. Additional permissions should be obtained from the applicable author or publisher of the image. Full text @ Cells