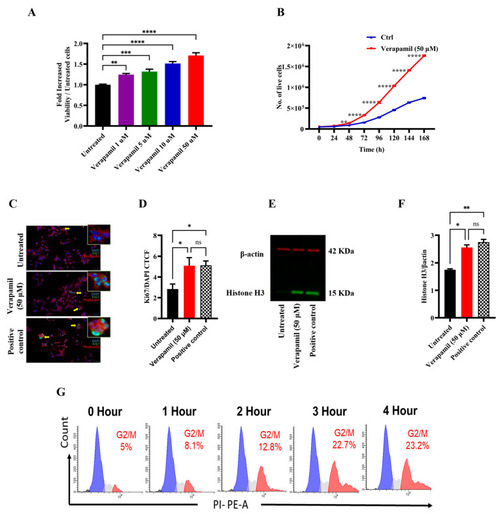
Proliferative effect of verapamil in MIN6 cells. (A) MIN6 cells were maintained in 5.6 mM glucose and were treated with different concentrations (1, 5, 10, and 50 μM) of verapamil for 24 h. (B) Growth curve of MIN6 cells cultured in 5.6 mM glucose media and treated with verapamil (50 μM, red line) in comparison with untreated cells (blue line). (C,D) Ki67 analysis showing the influence of verapamil on cell proliferation. MIN6 cells were cultured in serum-free conditions in the presence or absence of verapamil. Cells cytoskeletons were labeled with phalloidin (red) and the proliferation level was monitored with the expression of KI67 protein (green). Yellow arrows are presenting the cells expressing Ki67 in the nucleus (cyan color). DAPI was used to counterstain the nucleus. Scale bar = 50 μM, n = 2. The corrected total cell fluorescence (CTCF) was calculated from 10 different fields of each (n) number. (E,F) Western blot analysis of histone H3 expression corrected to β-actin with representative immunoblots, n = 2. Flow cytometry analysis was conducted to investigate the influence of verapamil induction in a time-dependent manner. (G) Histograms of the cell cycle phases. n = 4. The black, blue, gray, and red color histograms are representative of the percentage of the dead cells and the cells in G0/G1, S, and G2/M cell cycle phases, respectively. Data are presented as mean ± SEM values and were analyzed using one-way ANOVA with Tukey’s multiple comparisons test. ns: non-significant, * p ≤ 0.05, ** p ≤ 0.01, *** p ≤ 0.001, **** p ≤ 0.0001 versus control.
|
