FIGURE

Figure 6

ID
ZDB-FIG-240620-196
Publication
Arefanian et al., 2024 - Unraveling Verapamil's Multidimensional Role in Diabetes Therapy: From β-Cell Regeneration to Cholecystokinin Induction in Zebrafish and MIN6 Cell-Line Models
Other Figures
All Figure Page
Back to All Figure Page
Figure 6

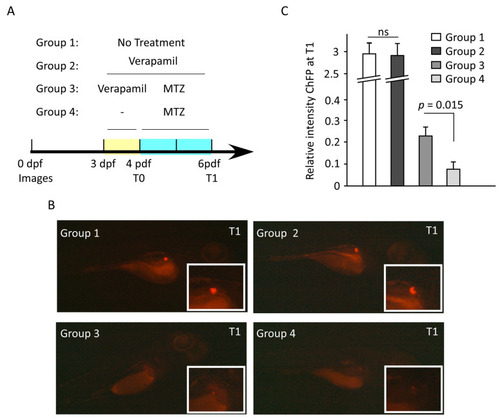
Verapamil pretreatment protects the pancreatic cells against MTZ-induced cytotoxic damage in zebrafish embryos. (A) Schematic timeline showing the experimental design and drug treatments. At 3 days post fertilization (dpf), four groups of embryos were treated as follows: Group 1, untreated embryos; Group 2, embryos treated with 10 µM verapamil for 72 h; Group 3, embryos treated with 10 µM verapamil for 24 h, followed by drug removal and administration of 10 mM MTZ for 48 h; Group 4, embryos treated with 10 mM MTZ at 4 dpf for 48 h. Insulin-producing pancreatic cells co-expressing mCherry fluorescence reporter protein (ChFP) were imaged at 4 dpf (T0) and 6 dpf (T1). For each group, the differences in ChFP intensity between T0 and T1 were determined. (B) Representative images of pancreatic cells in each group at T1. Inserts depict the magnified ChFP area. Images were taken using Stereo discovery 1.2 ZIESS microcopy. (C) Quantification of ChFP intensity in four groups at T1. No significant difference in fluorescence intensity was found between Groups 1 and 2. However, the fluorescence intensity in Group 3, which was pretreated with verapamil, was significantly higher as compared to Group 3, which was not pretreated with verapamil. Experiments were performed in triplicates (n = 20–30 embryos/group). Data represents the mean ± SEM values. ns: non-significant.

Expression Data

Expression Detail
Antibody Labeling
Phenotype Data

Phenotype Detail
Acknowledgments
This image is the copyrighted work of the attributed author or publisher, and ZFIN has permission only to display this image to its users. Additional permissions should be obtained from the applicable author or publisher of the image. Full text @ Cells