FIGURE SUMMARY
Title

Unraveling Verapamil's Multidimensional Role in Diabetes Therapy: From β-Cell Regeneration to Cholecystokinin Induction in Zebrafish and MIN6 Cell-Line Models

Authors
Arefanian, H., Al Madhoun, A., Al-Rashed, F., Alzaid, F., Bahman, F., Nizam, R., Alhusayan, M., John, S., Jacob, S., Williams, M.R., Abukhalaf, N., Shenouda, S., Joseph, S., AlSaeed, H., Kochumon, S., Mohammad, A., Koti, L., Sindhu, S., Abu-Farha, M., Abubaker, J., Thanaraj, T.A., Ahmad, R., Al-Mulla, F.
Source
Full text @ Cells

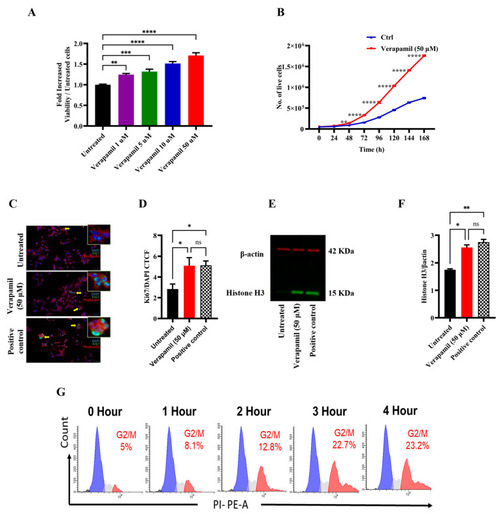
Proliferative effect of verapamil in MIN6 cells. (A) MIN6 cells were maintained in 5.6 mM glucose and were treated with different concentrations (1, 5, 10, and 50 μM) of verapamil for 24 h. (B) Growth curve of MIN6 cells cultured in 5.6 mM glucose media and treated with verapamil (50 μM, red line) in comparison with untreated cells (blue line). (C,D) Ki67 analysis showing the influence of verapamil on cell proliferation. MIN6 cells were cultured in serum-free conditions in the presence or absence of verapamil. Cells cytoskeletons were labeled with phalloidin (red) and the proliferation level was monitored with the expression of KI67 protein (green). Yellow arrows are presenting the cells expressing Ki67 in the nucleus (cyan color). DAPI was used to counterstain the nucleus. Scale bar = 50 μM, n = 2. The corrected total cell fluorescence (CTCF) was calculated from 10 different fields of each (n) number. (E,F) Western blot analysis of histone H3 expression corrected to β-actin with representative immunoblots, n = 2. Flow cytometry analysis was conducted to investigate the influence of verapamil induction in a time-dependent manner. (G) Histograms of the cell cycle phases. n = 4. The black, blue, gray, and red color histograms are representative of the percentage of the dead cells and the cells in G0/G1, S, and G2/M cell cycle phases, respectively. Data are presented as mean ± SEM values and were analyzed using one-way ANOVA with Tukey’s multiple comparisons test. ns: non-significant, * p ≤ 0.05, ** p ≤ 0.01, *** p ≤ 0.001, **** p ≤ 0.0001 versus control.

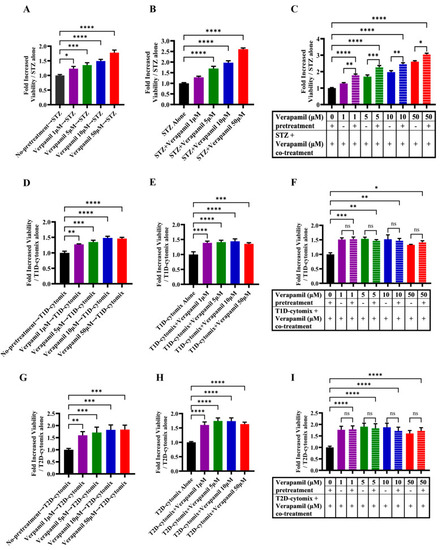
Protective effect of verapamil in MIN6 cells exposed to STZ, T1D-cytomix, or T2D-cytomix stressors. Bar graphs presenting MTT assay results as a ratio of each treatment over viability of MIN6 cells maintained in 5.6 mM glucose. (AC) Cells were stressed with streptozotocin (STZ). (A) Cells were pretreated with different concentrations (1, 5, 10, and 50 μM) of verapamil for 24 h, the media were changed, and cells were stressed by 3 mM of STZ for another 24 h. (B) Cells were treated with a combination of STZ (3 mM) and verapamil (1, 5, 10, and 50 μM) for 24 h. (C) Cells were pretreated with verapamil (1, 5, 10, and 50 μM) for 24 h, then fresh media containing both STZ (3 mM) and verapamil (1, 5, 10, and 50 μM) were supplied to the cells for another 24 h. (DF) Cells were stressed with T1D-cytomix (IL-1β: 50 ng/mL, TNF-α: 50 ng/mL, and INF-γ: 100 ng/mL) in each setting independently. (D) Cells were pretreated with different concentrations (1, 5, 10, and 50 μM) of verapamil for 24 h, then media were changed, and cells were stressed with T1D-cytomix for another 24 h. (E) Cells were treated with a combination of T1D-cytomix and verapamil (1, 5, 10, and 50 μM) for 24 h. (F) Cells were pretreated with verapamil (1, 5, 10, and 50 μM) for 24 h, then fresh media containing both T1D-cytomix and verapamil (1, 5, 10, and 50 μM) were supplied to the cells for another 24 h. (GI) Bar graphs presenting MTT assay results as a ratio of each treatment over the viability of cells stressed by T2D-cytomix (IL-1β: 50 ng/mL, TNF-α: 50 ng/mL, and Palmitic Acid: 500 μM) in each setting independently. (G) Cells were pretreated with different concentrations (1, 5, 10, and 50 μM) of verapamil for 24 h, then media were changed, and cells were stressed with T2D-cytomix for another 24 h. (H) Cells were treated with a combination of T2D-cytomix and different concentrations (1, 5, 10, and 50 μM) of verapamil for 24 h. (I) Cells were pretreated with different concentrations (1, 5, 10, and 50 μM) of verapamil for 24 h, then fresh media containing both T2D-cytomix and different concentrations (1, 5, 10, and 50 μM) of verapamil were supplied to the cells for another 24 h. Each experiment was performed by at least five independent repeats. The difference between the groups was statistically analyzed using two-way analysis of variance (ANOVA), and p values < 0.05 were considered significant difference. Data are presented as mean ± SEM, * p-value < 0.05, ** p-value < 0.01, *** p-value < 0.001, and **** p-value < 0.0001. ns: non-significant.

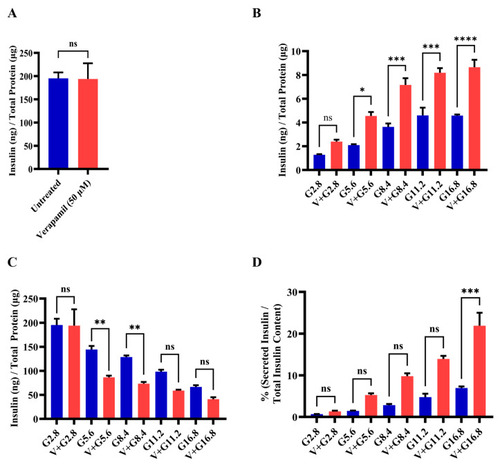
Functional effect of verapamil on the insulin content and glucose stimulated-insulin secretion (GSIS) rate of MIN6 cells. (A) Measured insulin content in MIN6 cells treated with 50 µM verapamil (red) for 24 h or left untreated (blue). (B) Total secreted insulin by MIN6 cells and (C) total insulin content in MIN6 cells when stimulated with different concentrations of glucose and either treated with 50 µM verapamil (red) for 24 h or left untreated (blue). (D) Percentage of secreted insulin over total insulin content of each condition. Each experiment was performed in 4 independent repeats. Difference between the groups was statistically analyzed using two-way analysis of variance (ANOVA), and p-values < 0.05 were considered statistically significant. Data are presented as mean ± SEM; * p-value < 0.05; ** p-value < 0.01; *** p-value < 0.001; and **** p-value < 0.0001, ns: non-significant.

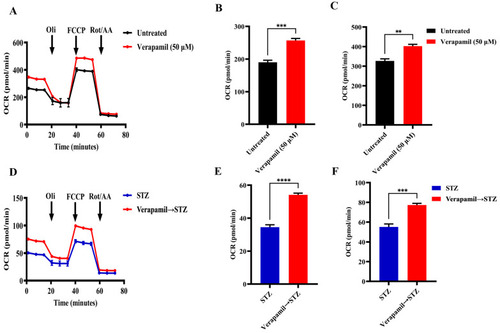
Verapamil pretreatment increases mitochondrial respiration in MIN6 cells treated with streptozotocin. MIN6 cells (4 × 10⁴) were cultured in 5.6 mM glucose media and treated overnight with verapamil (50 µM) or were left untreated. Cells were subsequently treated with streptozotocin (STZ, 3 mM) or left untreated and subjected to metabolic flux analysis. (A) Metabolic flux analysis measured oxygen consumption as cells were treated with Oligomycin (1 µM), Carbonyl cyanide 4-(trifluoromethoxy)phenylhydrazone (FCCP, 2 µM), and Rotenone/Antimycin A (Rot/AA, 0.5 µM). (B) Basal respiration in metabolic flux analysis before Oli administration. (C) Maximal respiration in metabolic flux analysis before Rot/AA administration. (D) Metabolic flux analysis of cells pretreated with verapamil prior to STZ treatment. (E) Basal respiration and (F) maximal respiration in metabolic flux analysis of cells pretreated with verapamil. Reported OCR was normalized to the extracted total protein as an indirect estimation of the number of cells subjected to metabolic flux analysis. Difference between the groups was statistically analyzed using two-way analysis of variance (ANOVA), and p-values < 0.05 were considered statistically significant, n = 4 per group, ** p-value < 0.01; *** p-value < 0.001; and **** p-value < 0.0001.

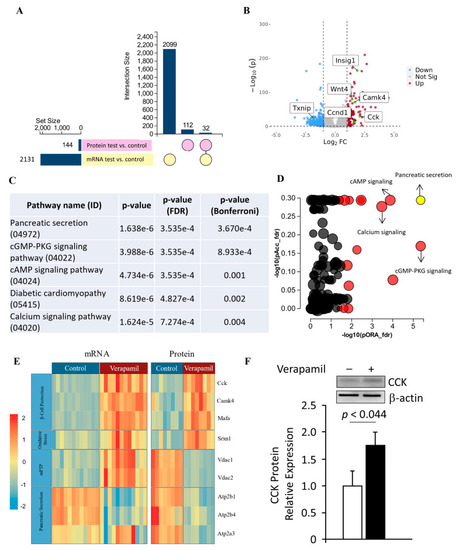
Transcriptomic and proteomic landscape of MIN6 cells treated with verapamil. (A) Out of a set size of 2131 genes (yellow) and proteins (pink), 2099 genes and 112 proteins were found to be differentially expressed. Of these, shared differential expressions of 32 genes and proteins were observed. (B) Volcano plot showing differentially expressed genes in MIN6 mouse beta cell line treated with verapamil (50 uM) for 24 h (|FC| > 2, p < 0.05). Vertical lines are drawn at the |log2FC| thresholds (C,D) Perturbation vs. over-representation pathway plot: dots representing the top 10 impacted pathways are positioned by their p-values from two different analyses: an impact analysis measuring total perturbation accumulation (pAcc) vs. a classical over-representation analysis (pORA). Pathways with significant combined p-values are shown in red. The selected pancreatic secretion pathway is shown in yellow. The size of each dot denotes the total number of genes in the corresponding pathway. (E) Protein and mRNA levels of key genes found to be up- or down-regulated when exposed to verapamil treatment, along with their respective molecular functions shown in the y axis. Each cell depicts one independent experiment. The expression profiles of the respective genes are depicted by color gradient (p < 0.05, |log2FC| > 1). The color scale indicates upregulation in red and downregulation in blue. (F) Western blot analysis of CCK expression normalized to β-actin expression; a representative immunoblot is shown.

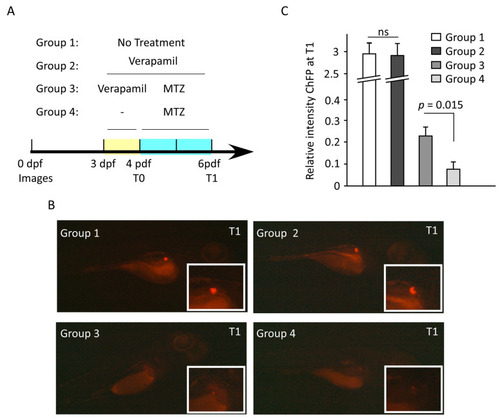
Verapamil pretreatment protects the pancreatic cells against MTZ-induced cytotoxic damage in zebrafish embryos. (A) Schematic timeline showing the experimental design and drug treatments. At 3 days post fertilization (dpf), four groups of embryos were treated as follows: Group 1, untreated embryos; Group 2, embryos treated with 10 µM verapamil for 72 h; Group 3, embryos treated with 10 µM verapamil for 24 h, followed by drug removal and administration of 10 mM MTZ for 48 h; Group 4, embryos treated with 10 mM MTZ at 4 dpf for 48 h. Insulin-producing pancreatic cells co-expressing mCherry fluorescence reporter protein (ChFP) were imaged at 4 dpf (T0) and 6 dpf (T1). For each group, the differences in ChFP intensity between T0 and T1 were determined. (B) Representative images of pancreatic cells in each group at T1. Inserts depict the magnified ChFP area. Images were taken using Stereo discovery 1.2 ZIESS microcopy. (C) Quantification of ChFP intensity in four groups at T1. No significant difference in fluorescence intensity was found between Groups 1 and 2. However, the fluorescence intensity in Group 3, which was pretreated with verapamil, was significantly higher as compared to Group 3, which was not pretreated with verapamil. Experiments were performed in triplicates (n = 20–30 embryos/group). Data represents the mean ± SEM values. ns: non-significant.

Acknowledgments
This image is the copyrighted work of the attributed author or publisher, and ZFIN has permission only to display this image to its users. Additional permissions should be obtained from the applicable author or publisher of the image. Full text @ Cells