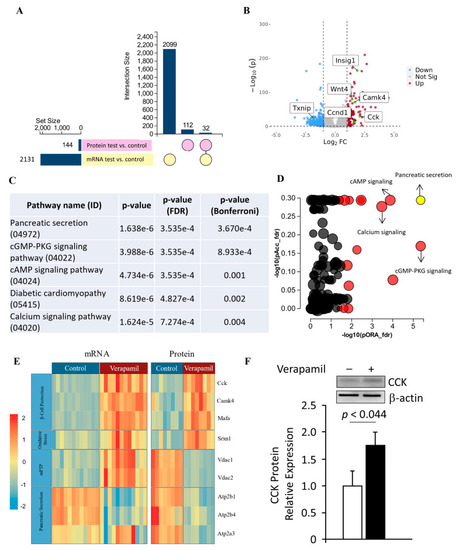
Transcriptomic and proteomic landscape of MIN6 cells treated with verapamil. (A) Out of a set size of 2131 genes (yellow) and proteins (pink), 2099 genes and 112 proteins were found to be differentially expressed. Of these, shared differential expressions of 32 genes and proteins were observed. (B) Volcano plot showing differentially expressed genes in MIN6 mouse beta cell line treated with verapamil (50 uM) for 24 h (|FC| > 2, p < 0.05). Vertical lines are drawn at the |log2FC| thresholds (C,D) Perturbation vs. over-representation pathway plot: dots representing the top 10 impacted pathways are positioned by their p-values from two different analyses: an impact analysis measuring total perturbation accumulation (pAcc) vs. a classical over-representation analysis (pORA). Pathways with significant combined p-values are shown in red. The selected pancreatic secretion pathway is shown in yellow. The size of each dot denotes the total number of genes in the corresponding pathway. (E) Protein and mRNA levels of key genes found to be up- or down-regulated when exposed to verapamil treatment, along with their respective molecular functions shown in the y axis. Each cell depicts one independent experiment. The expression profiles of the respective genes are depicted by color gradient (p < 0.05, |log2FC| > 1). The color scale indicates upregulation in red and downregulation in blue. (F) Western blot analysis of CCK expression normalized to β-actin expression; a representative immunoblot is shown.
|
