|
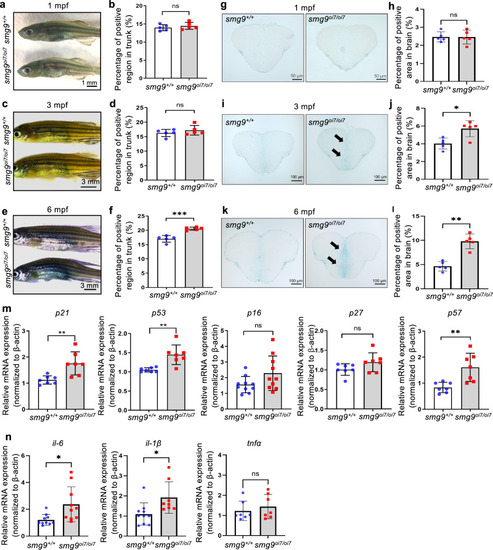
Age-related staining and markers in Smg9-deficient zebrafish. a, b SA-β-gal staining of the skin of smg9+/+ and smg9oi7/oi7 zebrafish at 1 mpf. Scale bar: 1 mm (a). Quantification of the percentage of positive areas in the trunk at 1 mpf (b). c, d SA-β-gal staining of the skin of smg9+/+ and smg9oi7/oi7 zebrafish at 3 mpf (c). Quantification of the percentage of positive areas in the trunk at 3 mpf. Scale bar: 3 mm (d). e, f SA-β-gal staining of the skin of smg9+/+ and smg9oi7/oi7 zebrafish at 6 mpf. Scale bar: 3 mm (e). Quantification of the percentage of positive areas in the trunk at 6 mpf (f). g, h SA-β-gal staining of the frozen brain sections of smg9+/+ and smg9oi7/oi7 zebrafish at 1 mpf. Scale bar: 50 μm (g). Quantification of the percentage of positive areas in the brain at 1 mpf (h). i, j SA-β-gal staining of the frozen brain sections of smg9+/+ and smg9oi7/oi7 zebrafish at 3 mpf. The arrows indicate positive regions. Scale bar: 100 μm (i). Quantification of the percentage of positive areas in the brain at 3 mpf (j). k, l SA-β-gal staining of the frozen brain sections of smg9+/+ and smg9oi7/oi7 zebrafish at 6 mpf. The arrows indicate positive regions. Scale bar: 100 μm (k). Quantification of the percentage of positive areas in the brain at 6 mpf (l). m Quantitative PCR analysis of p21, p53, p16, p27, and p57 expression in smg9+/+ and smg9oi7/oi7 zebrafish larvae at 14 dpf. n Quantitative PCR analysis of il-6, il-1β and tnfα expression in smg9+/+ and smg9oi7/oi7 zebrafish larvae at 14 dpf. Error bars indicate SD. *P < 0.05, ** P < 0.01, and *** P < 0.001. ns not significant.
|