|
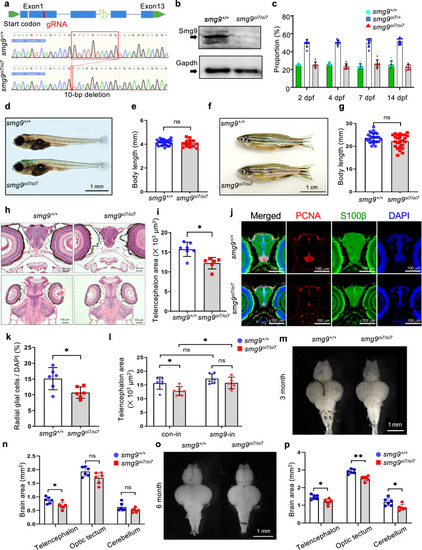
Smg9-deficient zebrafish display brain malformations. a Genomic locus diagram depicting the zebrafish smg9 gene and its 10-nucleotide deletion using CRISPR/Cas9. The red box indicates the mutated region in smg9oi7/oi7 zebrafish. b Western blot analyses of lysates from smg9+/+ and smg9oi7/oi7 larvae at 2 dpf to determine the Smg9 protein levels. c The percentage of smg9+/+, smg9oi7/+, and smg9oi7/oi7 zebrafish were determined from 2 to 14 dpf. d Representative images of smg9+/+ and smg9oi7/oi7 larvae at 14 dpf. Scale bar: 1 mm. e Body length of smg9+/+ and smg9oi7/oi7 larvae at 14 dpf. f Representative images of smg9+/+ and smg9oi7/oi7 fish at 3 mpf. Scale bar: 1 cm. g Body length of smg9+/+ and smg9oi7/oi7 zebrafish at 3 mpf. h Representative images of H&E staining of transverse and coronal sections of smg9+/+ and smg9oi7/oi7 larvae at 14 dpf. Scale bar: 50 µm in the upper panel and 100 µm in the lower panel. i Telencephalon areas of smg9+/+ and smg9oi7/oi7 larvae at 14 dpf were measured using transverse sections of H&E images. j Representative images of immunostaining of 14 dpf larval brain tissue with PCNA (red), S100β (green), and DAPI (blue). Scale bar: 100 µm. k Graph shows PCNA/S100β double-positive radial glial cells among DAPI-positive cells in the telencephalon of smg9+/+ and smg9oi7/oi7 larvae at 14 dpf. l Telencephalon size of 14 dpf smg9+/+ and smg9oi7/oi7 larvae injected with control (con-in) or zebrafish smg9 mRNA (smg9-in). m Representative images of the dissected brains of smg9+/+ and smg9oi7/oi7 zebrafish at 3 mpf. Scale bar: 1 mm. n Quantification of the areas of the telencephalon, optic tectum, and cerebellum in smg9+/+ and smg9oi7/oi7 zebrafish at 3 mpf. o Representative images of dissected brains of smg9+/+ and smg9oi7/oi7 zebrafish at 6 mpf. Scale bar: 1 mm. p Quantification of the areas of the telencephalon, optic tectum, and cerebellum in smg9+/+ and smg9oi7/oi7 zebrafish at 6 mpf. Error bars indicate SD. *P < 0.05, **P < 0.01, and ***P < 0.001. ns: not significant.
|