IMAGE

Fig. 4

ID
ZDB-IMAGE-240531-139
Source
Figures for Lai et al., 2024
Image
Figure Caption

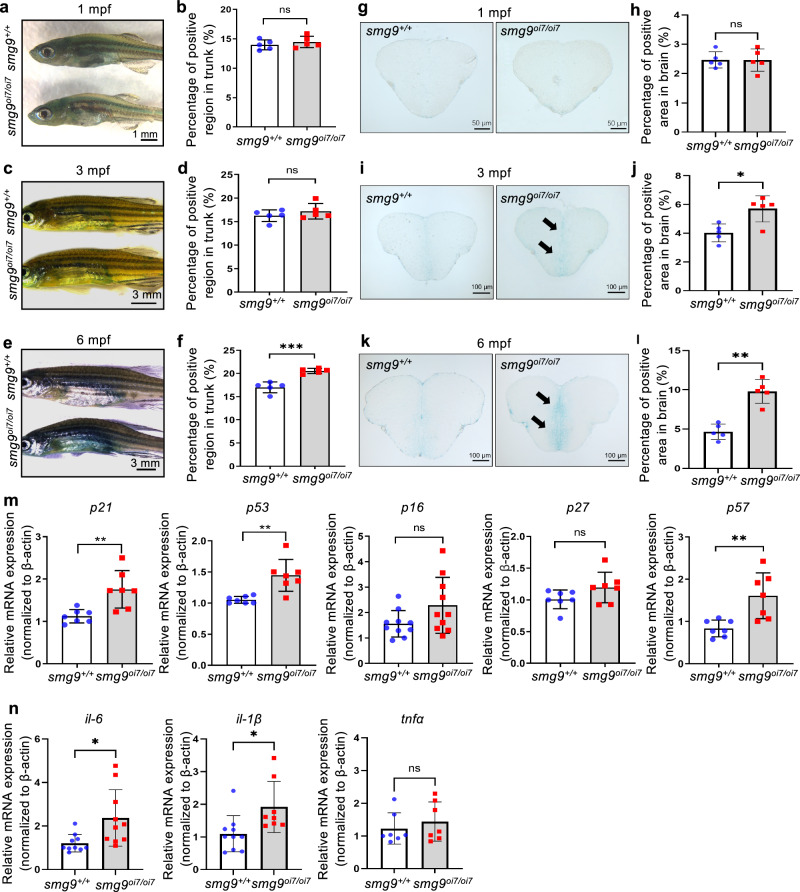
Fig. 4 Age-related staining and markers in Smg9-deficient zebrafish.

a, b SA-β-gal staining of the skin of smg9+/+ and smg9oi7/oi7 zebrafish at 1 mpf. Scale bar: 1 mm (a). Quantification of the percentage of positive areas in the trunk at 1 mpf (b). c, d SA-β-gal staining of the skin of smg9+/+ and smg9oi7/oi7 zebrafish at 3 mpf (c). Quantification of the percentage of positive areas in the trunk at 3 mpf. Scale bar: 3 mm (d). e, f SA-β-gal staining of the skin of smg9+/+ and smg9oi7/oi7 zebrafish at 6 mpf. Scale bar: 3 mm (e). Quantification of the percentage of positive areas in the trunk at 6 mpf (f). g, h SA-β-gal staining of the frozen brain sections of smg9+/+ and smg9oi7/oi7 zebrafish at 1 mpf. Scale bar: 50 μm (g). Quantification of the percentage of positive areas in the brain at 1 mpf (h). i, j SA-β-gal staining of the frozen brain sections of smg9+/+ and smg9oi7/oi7 zebrafish at 3 mpf. The arrows indicate positive regions. Scale bar: 100 μm (i). Quantification of the percentage of positive areas in the brain at 3 mpf (j). k, l SA-β-gal staining of the frozen brain sections of smg9+/+ and smg9oi7/oi7 zebrafish at 6 mpf. The arrows indicate positive regions. Scale bar: 100 μm (k). Quantification of the percentage of positive areas in the brain at 6 mpf (l). m Quantitative PCR analysis of p21, p53, p16, p27, and p57 expression in smg9+/+ and smg9oi7/oi7 zebrafish larvae at 14 dpf. n Quantitative PCR analysis of il-6, il-1β and tnfα expression in smg9+/+ and smg9oi7/oi7 zebrafish larvae at 14 dpf. Error bars indicate SD. *P < 0.05, ** P < 0.01, and *** P < 0.001. ns not significant.

Acknowledgments
This image is the copyrighted work of the attributed author or publisher, and ZFIN has permission only to display this image to its users. Additional permissions should be obtained from the applicable author or publisher of the image. Full text @ Commun Biol