
Fig. 4
- ID
- ZDB-FIG-240528-77
- Publication
- Ruparelia et al., 2024 - Atrogin-1 promotes muscle homeostasis by regulating levels of endoplasmic reticulum chaperone BiP
- Other Figures
- All Figure Page
- Back to All Figure Page
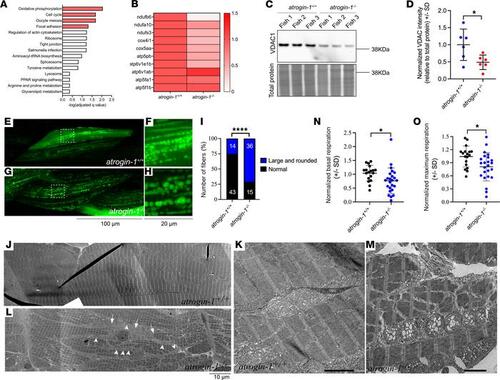
Atrogin-1 deficiency also results in altered mitochondrial dynamics. (A) Overrepresentation analyses on all differentially regulated proteins in atrogin-1–/– larvae revealed a significant enrichment of multiple Kyoto Encyclopedia of Genes and Genomes pathway terms, with oxidative phosphorylation (OXPHOS) being the most significant. (B) Heatmap of the relative abundance of OXPHOS proteins ndufb6, ndufa10, ndufs3, cox4i1, cox5aa, atp5pb, atp6v1e1b, atp6v1ab, atp5fa1, and atp5f1b in atrogin-1+/+ and atrogin-1–/– larvae. (C) Representative Western blot images for VDAC1, and total protein direct blue stain, on whole cell protein lysates obtained from 3 independent biological replicates, each containing multiple atrogin-1+/+ or atrogin-1–/– larvae. (D) Quantification of VDAC1 levels normalized to total protein, with atrogin-1–/p4 larvae displaying a significant reduction compared with atrogin-1+/+ larvae, as determined using an unpaired t test. Data are shown as mean ± SD. (E–H) Live images of 6 dpf methyl cellulose–treated atrogin-1+/+ (E and F) and atrogin-1–/– (G and H) larvae showing mosaic expression of actc1b:mitoGFP labeling the mitochondria in green. While atrogin-1+/+ larvae display small mitochondria some of which form an intricate network, mitochondria in atrogin-1–/– larvae are large and rounded. Scale bar: 100 μm (left); 20 μm (right). F and H are zoomed in views of E and G, respectively. (I) The proportion of muscle fibers displaying altered mitochondrial morphology in methyl cellulose–treated atrogin-1+/+ or atrogin-1–/– larvae, as per Fisher’s exact test. ****P < 0.0001. (J–M) Electron micrographs of the muscle in 6 dpf methyl cellulose–treated atrogin-1+/+ and atrogin-1–/– larvae. While atrogin-1+/+ larvae display normal sarcomeric and mitochondrial structure (J and K), atrogin-1–/– mutants (L and M) display fiber disintegration, evident by the disorganized arrangement of sarcomeres (arrow), and abnormal mitochondria with large and swollen matrices (arrowheads). K and M are zoomed in views of J and L, respectively. (N and O) 3 dpf methyl cellulose–treated atrogin-1–/– larvae show a significant reduction in basal (N) and maximum respiration (O) compared with atrogin-1+/+ larvae, as determined using an unpaired t test. Data are shown as mean ± SD.*P < 0.05; ****P< 0.0001. All experiments performed in triplicate, with the total number of fish examined in each replicate being documented in Supplemental Table 2. |