
Fig. 3
- ID
- ZDB-FIG-240528-76
- Publication
- Ruparelia et al., 2024 - Atrogin-1 promotes muscle homeostasis by regulating levels of endoplasmic reticulum chaperone BiP
- Other Figures
- All Figure Page
- Back to All Figure Page
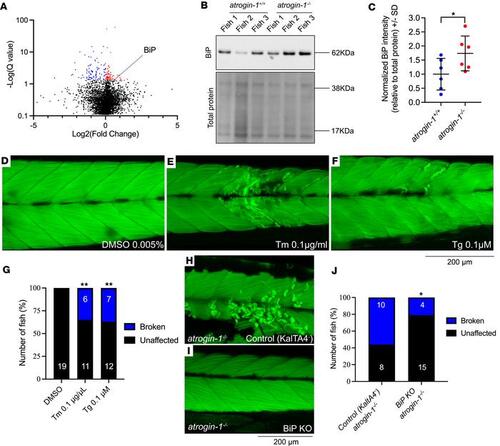
Atrogin-1 mutants display increased levels of BiP, which is sufficient to cause muscle fiber detachment. (A) Volcano plot highlighting differentially regulated proteins in atrogin-1–/– larvae compared with atrogin-1+/+ wild-type larvae – identified from untargeted proteomics. Proteins significantly (q < 0.05) upregulated and downregulated are shown in red and blue, respectively, as determined using an unpaired t test. (B) Representative Western blot images for BiP, and total protein direct blue stain, on whole cell protein lysates obtained from 3 independent biological replicates, each containing multiple atrogin-1+/+ or atrogin-1–/– larvae. (C) Quantification of BiP levels normalized to total protein with atrogin-1–/– larvae displaying a significant reduction compared with atrogin-1+/+, as determined using an unpaired t test. Data are shown as mean ± SD. (D–F) 6 dpf tunicamycin- (Tm-) or thapsigargin-treated (Tg-treated) larvae display muscle fiber detachment following incubation in methyl cellulose. (G) The percentage of affected larvae, with Tm or Tg treatment resulting in a significant increase in the proportion of fish displaying the muscle fiber detachment, as determined using a χ2 test. (H and I) Confocal images of F-actin–stained, methyl cellulose–treated, 6 dpf atrogin-1–/– mutants on the Tg(actc1b:KalTA4;cryaa:GFPpc54Tg) only [labeled as Control (KaltA4)] or Tg(actc1b:KalTA4;cryaa:GFPpc54Tg) and Tg(4XUAS:NLSCas9;cmlc2:RFP gl37Tg) (labeled as BiP KO) background. While control atrogin-1–/– mutants display fiber detachment, atrogin-1–/– mutants with BiP deficiency specifically in the muscle show normal muscle structure. (J) The percentage of affected atrogin-1–/– control larvae and BiP-KO larvae, with the latter having a significant decrease in the proportion of fish displaying the muscle fiber detachment, as determined using Fisher’s exact test. *P < 0.05, **P < 0.01. All experiments performed in triplicate with the total number of fish examined in each replicate being documented in Supplemental Table 2. Scale bar: 200 μm. |