- Title
-
Atrogin-1 promotes muscle homeostasis by regulating levels of endoplasmic reticulum chaperone BiP
- Authors
- Ruparelia, A.A., Montandon, M., Merriner, J., Huang, C., Wong, S.F.L., Sonntag, C., Hardee, J.P., Lynch, G.S., Miles, L.B., Siegel, A., Hall, T.E., Schittenhelm, R.B., Currie, P.D.
- Source
- Full text @ JCI Insight
|
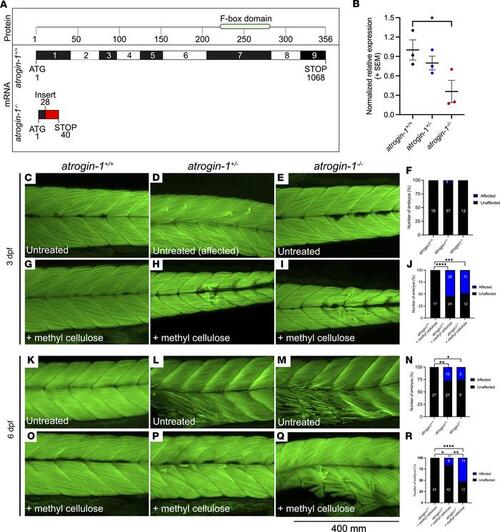
Atrogin-1 deficiency results in contraction-dependent muscle fiber detachment. Schematic of wild-type atrogin-1 (atrogin-1+/+) and mutant atrogin-1 (atrogin-1–/–) protein structure and mRNA sequence, with the mutant predicted to incorporate a premature stop in exon 1. The mutant was generated using CRISPR/Cas9 genome editing, which resulted in a 34 bp insertion (red). Numbers in the protein box are amino acids, and numbers in the mRNA box are base pairs. (B) qRT-PCR analysis showing significant reduction in atrogin-1 levels in atrogin-1–/– mutants compared with atrogin-1+/+ wild-type larvae. Error bars represent mean ± SEM for 3 replicate experiments, with each experiment comprising a pooled sample of at least 5 fish. *P < 0.05 determined using a 1-way ANOVA with Tukey’s multiple correction post hoc test. Muscle fibers span the entire length of the somite in the 3 dpf atrogin-1+/+ (C), atrogin-1 heterozygous (atrogin-1+/–) (D), and atrogin-1–/– mutant (E) larvae, as seen by F-Actin labeling. (F) Quantification of the muscle phenotype, with atrogin-1+/+, atrogin-1+/–, and atrogin-1–/– displaying indistinguishable muscle structure, as determined using a χ2 test. Incubation of 3 dpf atrogin-1+/– (H) and atrogin-1–/– (I) in methyl cellulose results in muscle fiber detachment, which is not evident in atrogin-1+/+ larvae (G). (J) Percentage of affected atrogin-1+/+, atrogin-1+/–, and atrogin-1–/– larvae, with the latter 2 genotypes having a significant increase in the proportion of fish displaying the muscle fiber detachment, as determined using a χ2 test. At 6 dpf, atrogin-1+/– (L) and atrogin-1–/– (M) display sporadic muscle fiber detachment but not in atrogin-1+/+ larvae (K). (N) Percentage of affected atrogin-1+/+, atrogin-1+/–, and atrogin-1–/– larvae, with the latter 2 genotypes having a significant increase in the proportion of fish displaying the muscle fiber detachment, as determined using a χ2 test. Methyl cellulose incubation of 6 dpf atrogin-1+/– (P) and atrogin-1–/– (Q) results in muscle fiber detachment, which is not evident in atrogin-1+/+ larvae (O). (R) Percentage of affected atrogin-1+/+, atrogin-1+/–, and atrogin-1–/– larvae, with the latter 2 genotypes having a significant increase in the proportion of fish displaying the muscle fiber detachment, as determined using a χ2 test. *P < 0.05, **P < 0.01, ***P < 0.001, ****P < 0.0001. All experiments were performed in triplicate, with the total number of fish examined in each replicate documented in Supplemental Table 2. |
|
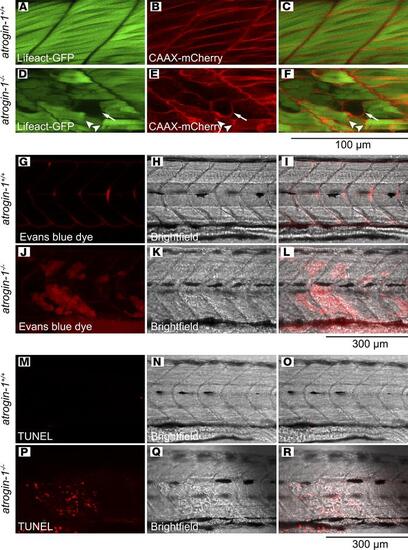
Atrogin-1 deficiency results in impaired membrane integrity and apoptosis. Live images of methyl cellulose–treated 6 dpf atrogin-1+/+ (A–C) and atrogin-1–/– (D–F) on the (Tg(actc1b:Lifeact-GFP);Tg(actc1b:CAAX-mCherry) background, whereby the actin filaments within the muscle fibers are labeled with GFP and membrane and t-tubules with mCherry. While muscle cells in the atrogin-1+/+ wild-type larvae span the entire length of the somite, with the sarcolemma fully surrounding each cell, atrogin-1–/– mutants display detached muscle fibers that are surrounded with irregular sections of sarcolemma, along with presence of abnormal sarcolemma vacuoles. Live images of methyl cellulose–treated 6 dpf atrogin-1+/+ (G–I) and atrogin-1–/– (J–L) larvae injected with Evans blue dye. atrogin-1–/– mutants displayed an accumulation of the dye, which is absent in atrogin-1+/+ larvae. TUNEL staining on 3 dpf methyl cellulose–treated atrogin-1+/+ (M–O) and atrogin-1–/– (P–R) larvae, with the latter displaying TUNEL in areas where the muscle cell had detached. Scale bar: 100 μm (A–F); 300 μm (G–R). |
|
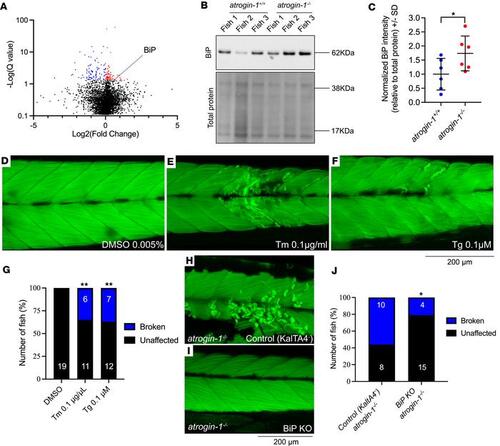
Atrogin-1 mutants display increased levels of BiP, which is sufficient to cause muscle fiber detachment. (A) Volcano plot highlighting differentially regulated proteins in atrogin-1–/– larvae compared with atrogin-1+/+ wild-type larvae – identified from untargeted proteomics. Proteins significantly (q < 0.05) upregulated and downregulated are shown in red and blue, respectively, as determined using an unpaired t test. (B) Representative Western blot images for BiP, and total protein direct blue stain, on whole cell protein lysates obtained from 3 independent biological replicates, each containing multiple atrogin-1+/+ or atrogin-1–/– larvae. (C) Quantification of BiP levels normalized to total protein with atrogin-1–/– larvae displaying a significant reduction compared with atrogin-1+/+, as determined using an unpaired t test. Data are shown as mean ± SD. (D–F) 6 dpf tunicamycin- (Tm-) or thapsigargin-treated (Tg-treated) larvae display muscle fiber detachment following incubation in methyl cellulose. (G) The percentage of affected larvae, with Tm or Tg treatment resulting in a significant increase in the proportion of fish displaying the muscle fiber detachment, as determined using a χ2 test. (H and I) Confocal images of F-actin–stained, methyl cellulose–treated, 6 dpf atrogin-1–/– mutants on the Tg(actc1b:KalTA4;cryaa:GFPpc54Tg) only [labeled as Control (KaltA4)] or Tg(actc1b:KalTA4;cryaa:GFPpc54Tg) and Tg(4XUAS:NLSCas9;cmlc2:RFP gl37Tg) (labeled as BiP KO) background. While control atrogin-1–/– mutants display fiber detachment, atrogin-1–/– mutants with BiP deficiency specifically in the muscle show normal muscle structure. (J) The percentage of affected atrogin-1–/– control larvae and BiP-KO larvae, with the latter having a significant decrease in the proportion of fish displaying the muscle fiber detachment, as determined using Fisher’s exact test. *P < 0.05, **P < 0.01. All experiments performed in triplicate with the total number of fish examined in each replicate being documented in Supplemental Table 2. Scale bar: 200 μm. |
|
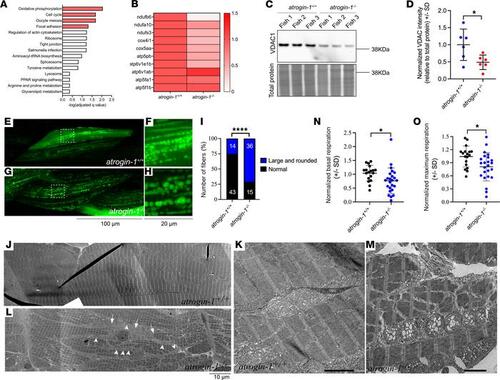
Atrogin-1 deficiency also results in altered mitochondrial dynamics. (A) Overrepresentation analyses on all differentially regulated proteins in atrogin-1–/– larvae revealed a significant enrichment of multiple Kyoto Encyclopedia of Genes and Genomes pathway terms, with oxidative phosphorylation (OXPHOS) being the most significant. (B) Heatmap of the relative abundance of OXPHOS proteins ndufb6, ndufa10, ndufs3, cox4i1, cox5aa, atp5pb, atp6v1e1b, atp6v1ab, atp5fa1, and atp5f1b in atrogin-1+/+ and atrogin-1–/– larvae. (C) Representative Western blot images for VDAC1, and total protein direct blue stain, on whole cell protein lysates obtained from 3 independent biological replicates, each containing multiple atrogin-1+/+ or atrogin-1–/– larvae. (D) Quantification of VDAC1 levels normalized to total protein, with atrogin-1–/p4 larvae displaying a significant reduction compared with atrogin-1+/+ larvae, as determined using an unpaired t test. Data are shown as mean ± SD. (E–H) Live images of 6 dpf methyl cellulose–treated atrogin-1+/+ (E and F) and atrogin-1–/– (G and H) larvae showing mosaic expression of actc1b:mitoGFP labeling the mitochondria in green. While atrogin-1+/+ larvae display small mitochondria some of which form an intricate network, mitochondria in atrogin-1–/– larvae are large and rounded. Scale bar: 100 μm (left); 20 μm (right). F and H are zoomed in views of E and G, respectively. (I) The proportion of muscle fibers displaying altered mitochondrial morphology in methyl cellulose–treated atrogin-1+/+ or atrogin-1–/– larvae, as per Fisher’s exact test. ****P < 0.0001. (J–M) Electron micrographs of the muscle in 6 dpf methyl cellulose–treated atrogin-1+/+ and atrogin-1–/– larvae. While atrogin-1+/+ larvae display normal sarcomeric and mitochondrial structure (J and K), atrogin-1–/– mutants (L and M) display fiber disintegration, evident by the disorganized arrangement of sarcomeres (arrow), and abnormal mitochondria with large and swollen matrices (arrowheads). K and M are zoomed in views of J and L, respectively. (N and O) 3 dpf methyl cellulose–treated atrogin-1–/– larvae show a significant reduction in basal (N) and maximum respiration (O) compared with atrogin-1+/+ larvae, as determined using an unpaired t test. Data are shown as mean ± SD.*P < 0.05; ****P< 0.0001. All experiments performed in triplicate, with the total number of fish examined in each replicate being documented in Supplemental Table 2. |
|
BiP accumulation is also responsible for the impaired mitochondrial dynamics. Live images of 6 dpf DMSO- (A and B), tunicamycin- (Tm-) (C and D), or thapsigargin-treated (Tg-treated) (E and F) larvae showing mosaic expression of actc1b:mitoGFP labeling the mitochondria in green. While DMSO-treated larvae display small mitochondria, some of which form an intricate network, mitochondria in Tm- and Tg-treated larvae were large and rounded, as determined using a χ2 test. B, D, and F (scale bar: 15 μm) are zoomed in views of A, C, and E (scale bar: 100 μm), respectively. (G) The proportion of muscle fibers displaying altered mitochondrial morphology following DMSO, Tm, or Tg treatment, determined using a χ2 test. (H–O) Live images of 6 dpf larvae coexpressing Mito-GFP with mCherry (H–K) or BiP-mCherry (L–O). K and O are zoomed in views of J and N, respectively. Scale bar: 150 μm (first, second, and third columns); 15 μm (last column). (P) The proportion of muscle fibers displaying altered mitochondrial morphology comparing mCherry overexpression with BiP overexpression, as per Fisher’s exact test. (Q and R) Live images of 6 dpf atrogin-1–/– mutant larvae on the Tg(actc1b:KalTA4;cryaa:GFPpc54Tg) only (labeled as Control (KaltA4)) or Tg(actc1b:KalTA4;cryaa:GFPpc54Tg) and Tg(4XUAS:NLSCas9;cmlc2:RFP gl37Tg) (labeled as BiP KO) background, showing mosaic expression of actc1b:mitoGFP labeling the mitochondria in green. While control atrogin-1–/– mutants display large and rounded mitochondria, atrogin-1–/– mutants with BiP deficiency specifically in the muscle have small mitochondria that form an intricate network, as determined using a χ2 test. Scale bar: 100 μm. (S) The proportion of muscle fibers displaying altered mitochondrial morphology in control and BiP-KO atrogin-1–/– mutants, as per Fisher’s exact test. *P < 0.05, ***P < 0.001. All experiments performed in triplicate with the total number of fish examined in each replicate being documented in Supplemental Table 2. |
|
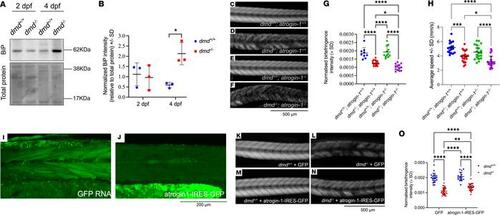
Atrogin-1 is a modifier of and contributes to the pathogenesis of Duchenne muscular dystrophy. (A) Representative Western blot image for BiP, and total protein direct blue stain, on whole cell protein lysates obtained from 2 dpf and 4 dpf dmd+/+ or dmd–/– larvae. (B) Quantification of BiP levels normalized to total protein with 4 dpf dmd–/– larvae displaying a significant increase compared with dmd+/+ larvae, as determined using a 2-way ANOVA with Šidák’s multiple correction post hoc test. Data are shown as mean ± SD. (C–F) Representative birefringence images of 4 dpf dmd+/+; atrogin-1+/+ wild-type larvae and dmd–/– and atrogin-1–/– single and double mutants. Scale bar: 500 μm. (G) Quantification of normalized birefringence intensity, which is the mean birefringence intensity relative to area, in 4 dpf dmd+/+; atrogin-1+/+ wild-type larvae and dmd–/– and atrogin-1–/– single and double mutants, analyzed using a 1-way ANOVA with Tukey’s multiple correction post hoc test. Data are shown as mean ± SD. (H) Average speed, in mm/s, of dmd+/+; atrogin-1+/+ wild-type larvae and dmd–/– and atrogin-1–/– single and double mutants, as analyzed using as a 1-way ANOVA with Tukey’s multiple correction post hoc test. Data are shown as mean ± SEM for 3–4 biological replicates. (I and J) Live images of 4 dpf larvae expressing GFP RNA or atrogin-1-IRES-GFP RNA. Scale bar: 200 μm. (K–N) Birefringence images of 4 dpf dmd+/+ and dmd–/– larvae injected with GFP RNA or atrogin-1-IRES-GFP RNA. Scale bar: 500 μm. (O) Quantification of normalized birefringence intensity, which is the mean birefringence intensity relative to area, in 4 dpf dmd+/+ or dmd–/– larvae injected with GFP RNA or atrogin-1-IRES-GFP RNA, as analyzed using a 2-way ANOVA with Šidák’s multiple correction post hoc test. Data are shown as mean ± SD. *P < 0.05, **P < 0.01, ***P < 0.001, ****P < 0.0001. All experiments performed in triplicate with the total number of fish examined in each replicate being documented in Supplemental Table 2. |
|
BiP inhibition rescues muscle function in DMD. (A–C) Representative birefringence images of 6 dpf DMSO-treated dmd+/+ and dmd–/– larvae and HM03-treated dmd–/– larvae. (D) Quantification of normalized birefringence intensity, which is the mean birefringence intensity relative to area, in 6 dpf DMSO- or HM03-treated dmd+/+ and dmd–/– larvae, as analyzed using a 2-way ANOVA with Šidák’s multiple correction post hoc test. Data are shown as mean ± SD. (E) Average speed, in mm/s, of 6 dpf DMSO- or HM03-treated dmd+/+ and dmd–/– larvae. Data are shown as mean ± SEM for 3–4 biological replicates and were analyzed using a 2-way ANOVA with Šidák’s multiple correction post hoc test. *P < 0.05, **P < 0.01, ***P < 0.001, ****P < 0.0001. All experiments performed in triplicate with the total number of fish examined in each replicate being documented in Supplemental Table 2. |

